
EQUITY RISK MONITOR HIGHLIGHTS
WEEK ENDED JULY 12, 2024
- An unusually negative week for the Size factor
- While at the same time: STOXX® US Small Cap handily beat STOXX US last week, but small cap risk also spiked
- STOXX® Japan: Strong returns with much broader sector contribution than the US
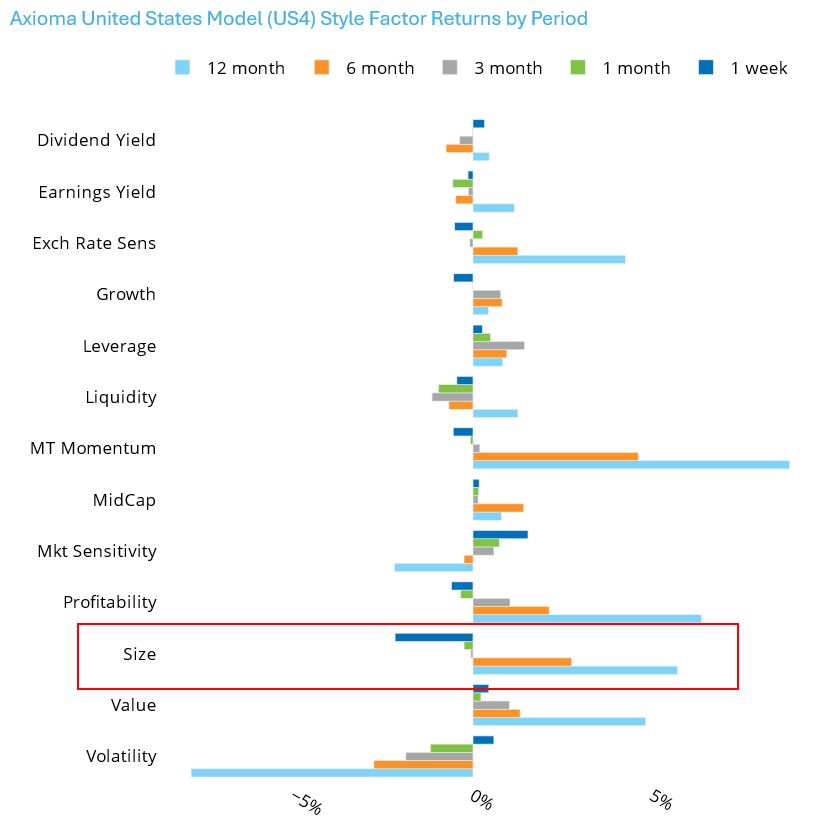
An unusually negative week for the Size factor
The return to Size in the Axioma US4 medium-horizon model over the past week was extremely negative – more than two standard deviations below what was expected at the beginning of the week. In addition, the Size return for the five days ended July 12 was more negative than we have seen in over a year, with the return falling between the second and third percentile of five-day Size return values since 1982. The five-day results were driven by one day – July 11 – in which the Size factor had one of its most negative returns in the history of the model, one that was more than a five-standard deviation event.
Still, the US market (as defined by the STOXX® US Index) rose for the five-day period, despite the poor showing of six of the 10 biggest names. The breadth in the market — the percent of names that fared better than the market overall — was the best it has been in at least a year, with about 70% of names beating the index.
Perhaps the focus away from just a few large names portends a positive preview to earnings season?
See graphs from the STOXX US Equity Risk Monitor as of July 12, 2024:

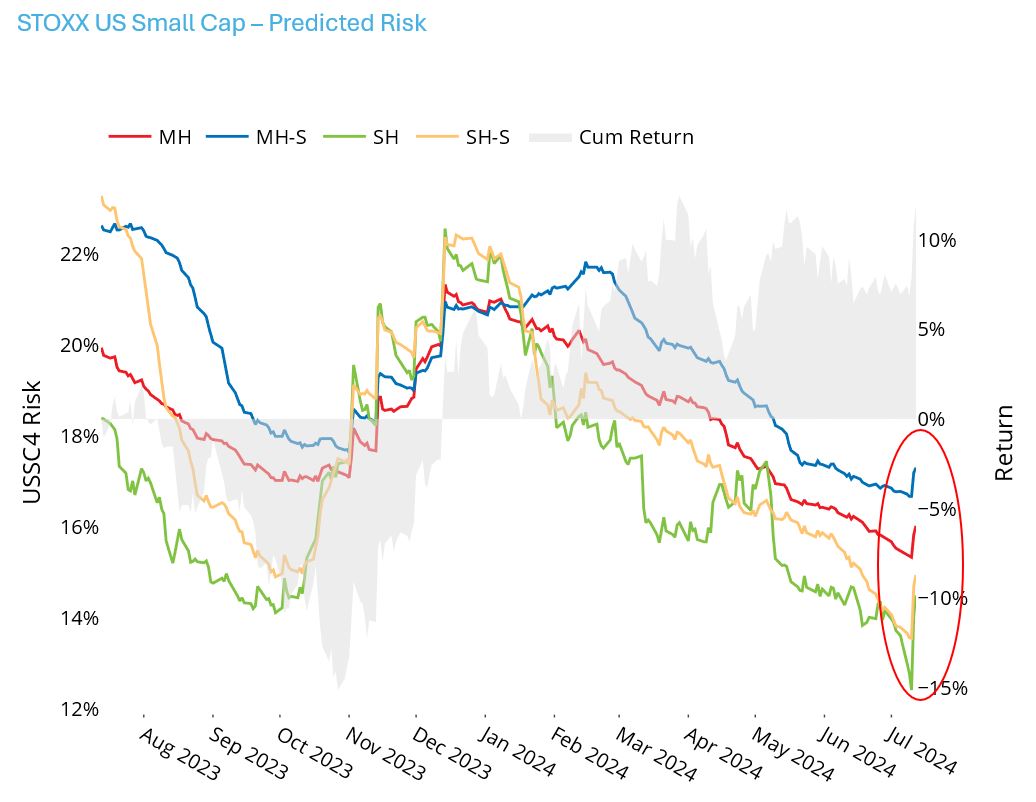
STOXX® US Small Cap handily beat STOXX US last week, but small cap risk also spiked
Return to the Size factor is distinct from the difference in returns of small cap and large cap indices. The former is subject to standardization and winsorization of exposures and holds all other factors (such as industries and the market) constant. It is the return to a portfolio with an exposure of one standard deviation to the Size factor and no net exposure to anything else. The latter is merely the difference in returns between an index of large-cap stocks and one made up of small-cap names. However, the Size factor and Large-Small index difference in the US are highly correlated, and this was very apparent on the aforementioned July 11. On that day, the STOXX US Index was down 0.84% while the STOXX US Small Cap index gained 2.7%, its highest one-day return of this year, and one that fell in the top 3% of daily returns for the small-cap index since 2018. The daily gap between the two of 3.5% was the highest it has been since at least 2018.
The substantial one-day return for STOXX US Small Cap also had an impact on index risk, according to all four variants of the Axioma US Small Cap model. Short-horizon risk forecasts, both statistical and fundamental, saw the biggest uptick, but even the medium-horizon models saw risk spike. The five-day increases in risk fell into the top 5-10% of five-day increases since 2018, but the one-day increases on July 11th were among the highest in that history.
See graph from the STOXX US Small Cap Equity Risk Monitor as of July 12, 2024:
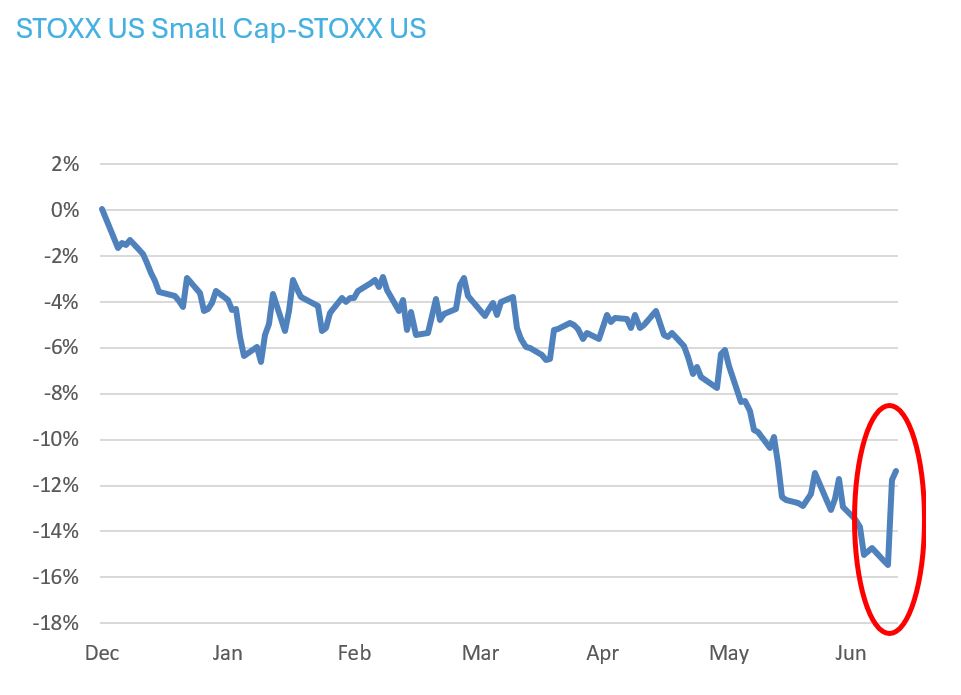
And of course, the relative dominance of US Small Cap versus its large/mid-cap counterpart is very recent. Until July 9 the STOXX US Small Cap was 15% behind the STOXX US year to date, while the spread ended last week at less than 12%.
The following graph does not appear in the equity risk monitors but is available on request.
STOXX® Japan: Strong returns with much broader sector contribution than the US
There has been so much attention paid to the US market this year, but the STOXX® Japan index has been extremely strong as well. The STOXX Japan Index has gained almost 30% over the past year (in JPY), most of that year to date. The STOXX US Index has gained 24% over the past year (in USD), also mainly in 2024.
The contribution to returns by sector looks quite different between the two countries, however. The return in Japan is much more broad-based, with Financials, Industrials and Consumer Discretionary each accounting for a substantial portion of return. Information Technology has also contributed to the success of the Japanese market, but not to anywhere near the same degree as in the US, where the sector drove about half the market return, as we have noted many times this year in our regular commentary.
See graphs from the STOXX US and STOXX Japan Equity Risk Monitors as of July 12, 2024: