

EQUITY RISK MONITOR HIGHLIGHTS
WEEK ENDED FEBURARY 14, 2025
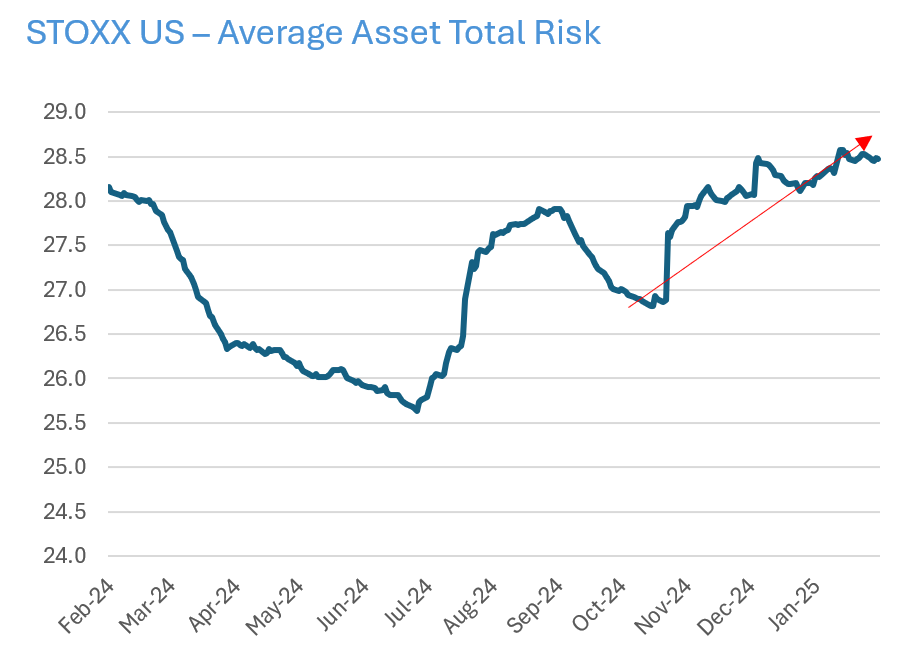
• Despite increasing uncertainty, predicted risk for the US has fallen
• Significant changes in sector factor exposures
• Momentum continues on a tear
Despite increasing uncertainty, predicted risk for the US has fallen
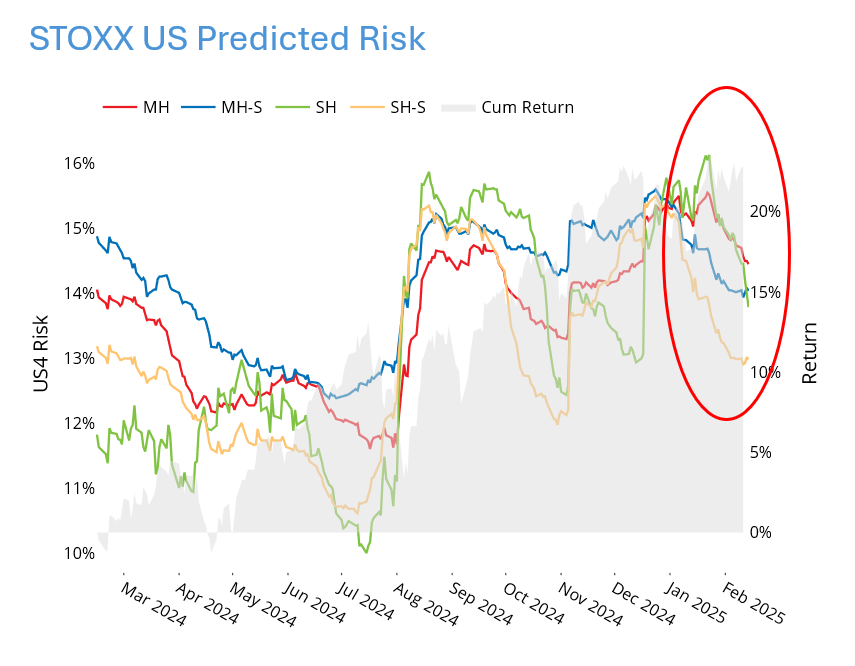
Predicted risk for the STOXX US index from all four variants of the Axioma US4 model has fallen from its recent peak (which was in mid-January for the fundamental and mid-end of December for the statistical variants), somewhat surprisingly as uncertainty about the economy, the direction of inflation especially after the most recent report that was hotter than expected, mass US government layoffs, etc. continues (and continues to confound those of us following the risk environment closely). Digging slightly more deeply, we observe that
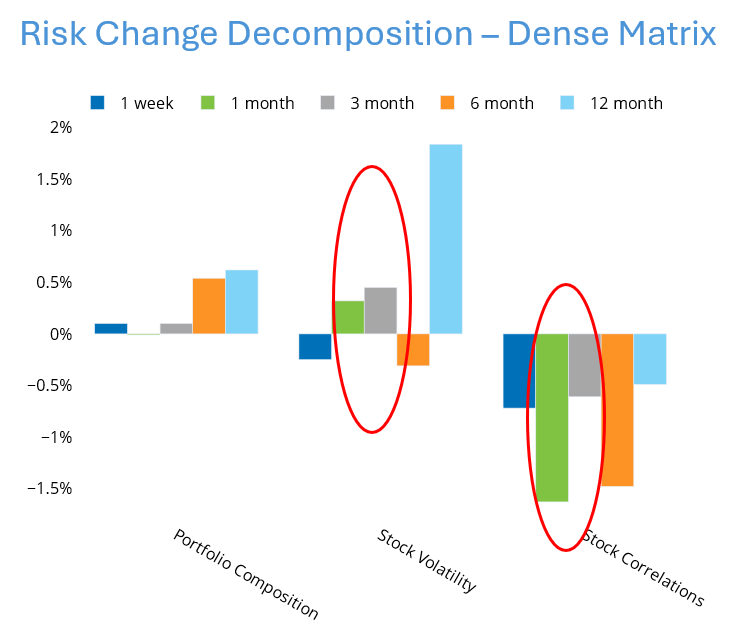
- Average asset volatility has increased about 6% since the US election, which would have accounted for a 50-basis-point increase in risk, all else being equal (see chart on decomposition of the change in risk).
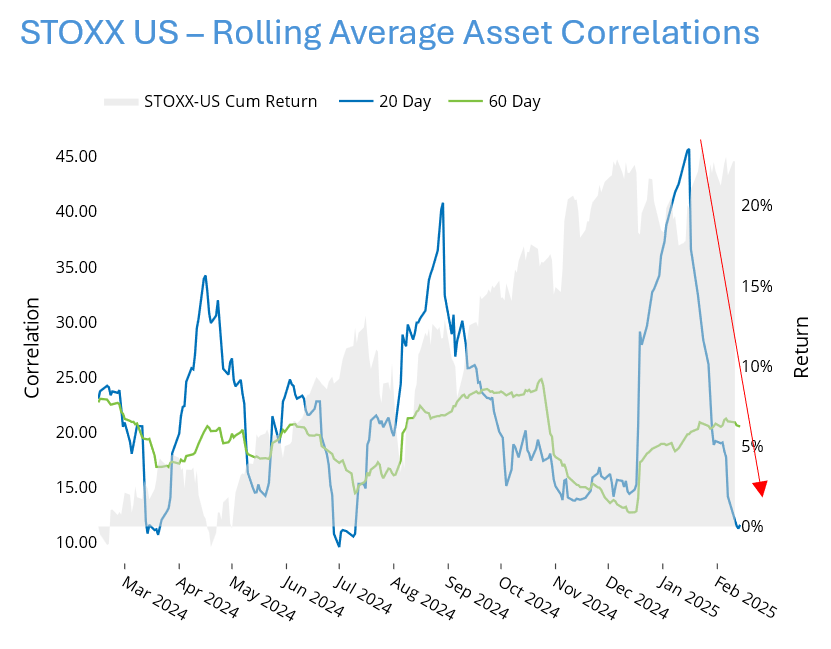
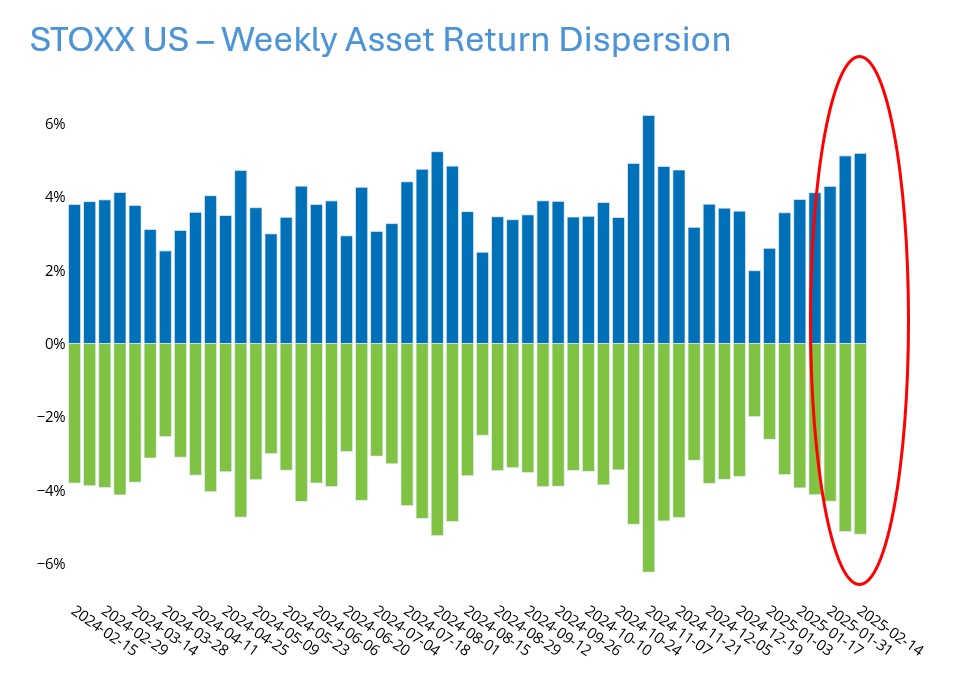
- At the same time, however, correlations dropped substantially, as investors sorted through the potential impact of various tariffs and other policy changes, and identified winners and losers, thereby driving correlations down (especially over the short-term 20 days we calculate) and dispersion up.
- The risk-dampening impact of the lower correlations more than offset the risk-enhancing driver of higher volatility, leading to a decrease in overall predicted volatility.
- It’s not just our risk models. VIX remains in the bottom third of its levels since 1990.
Note that my colleague Olivier d’Assier also addresses this in his weekly ROOF highlights; his take is that the correlation impact is likely to wane as we move out of earnings season and investors focus more on the continued policy uncertainties. And to be sure, predicted volatility remains well above its lows from last summer.
See charts from the February 14, 2025 STOXX US Equity Risk Monitor
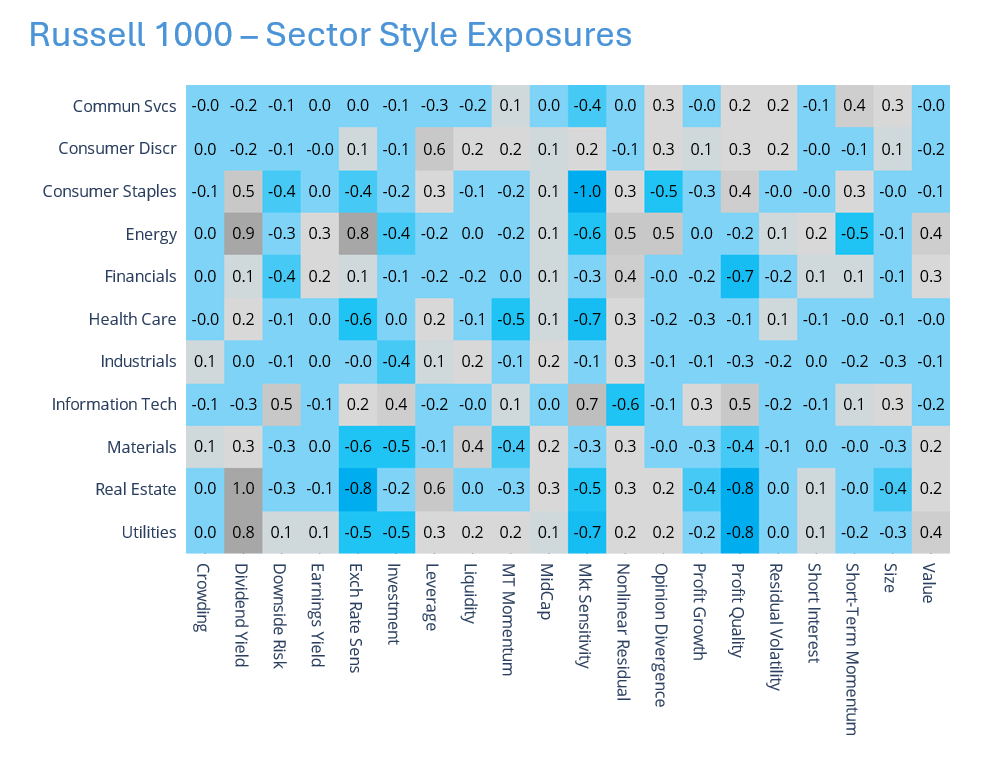
Significant changes in sector factor exposures
Although in many cases, by design, sectors often do not show big exposures to our US5 model factors, in some cases there are significant exposures and/or big changes in exposure. Those changes in exposure can impact active risk, and even if they do not they can impart information about how a sector may be changing.
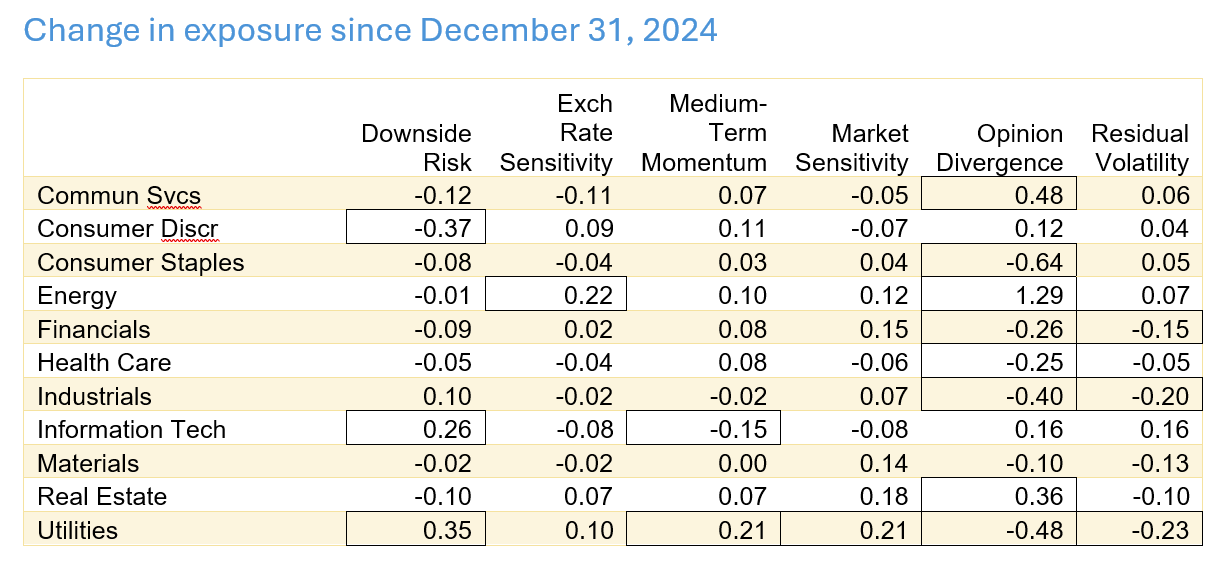
We calculated changes since the end of 2024 and notice that the sector distribution across a few factors has changed substantially. The second table below highlights the biggest changes. It is clear that the exposures did not change for all sectors, however a few do stand out.
Consumer Discretionary experienced a large decline in its exposure to Downside Risk, and now has an exposure of 0. At the same time, Information Technology (still negative but less so) and Utilities (now 0) saw increases – meaning the latter two are likely to be more volatile going forward than they were in the past, if not more volatile than other sectors. Energy is now more highly exposed to Exchange Rate Sensitivity, with one of the highest sector exposures to a factor.
While Information Technology still has a positive exposure to Medium-Term Momentum, that exposure has fallen since year-end as some of the stocks have taken a breather. (In other analysis we see that while some of the biggest contributors to US Momentum’s performance have been in the Technology sector, companies in Consumer Discretionary, Communications Services, Financials, and even Industrials and Health Care have also contributed, so the performance – discussed below – has been well diversified.) The momentum of Utilities has picked up since year end, and is now slightly positive.
Utilities still have a high negative exposure to Market Sensitivity, although less so than at the end of 2024. Financials (negative), Industrials (negative) and Utilities (neutral) have all seen their exposure to Residual Volatility fall.
The biggest changes came from Opinion Divergence, where seven sectors saw changes of more than 0.2. Consumer Staples, Health Care and Industrials went from positive to negative, Energy and Real Estate from negative to positive, Financials from positive to neutral and Utilities from more positive to slightly positive. (For those readers not familiar with this factor, high opinion divergence means that recent volume has been higher than that of a short-term model of daily volume versus daily price moves. High Opinion Divergence is expected to produce positive returns – it means there is high uncertainty about the name, and high uncertainty depresses prices. When news arrives to resolve the uncertainty – good or bad – prices can then rise.)
Notably, no sector shows a very positive or negative exposure to Crowding or Short Interest, and that has not changed substantially since the beginning of the year. And we did not include Short-Term Momentum in this analysis because it is the most likely to see big changes that could reverse quickly.
While the market may appear calm on the surface, the big changes in Opinion Divergence suggest the proverbial duck is swimming like crazy under the surface as investors try to decide which names will benefit from or be hurt in the current environment.
See chart from the February 14, 2025 Russell 1000 Equity Risk Monitor
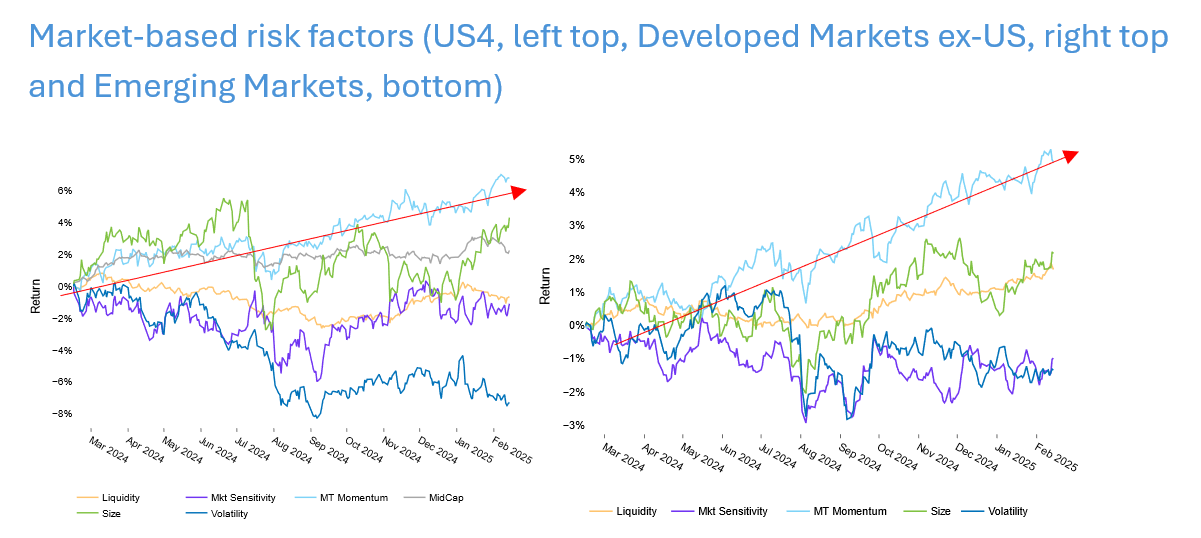
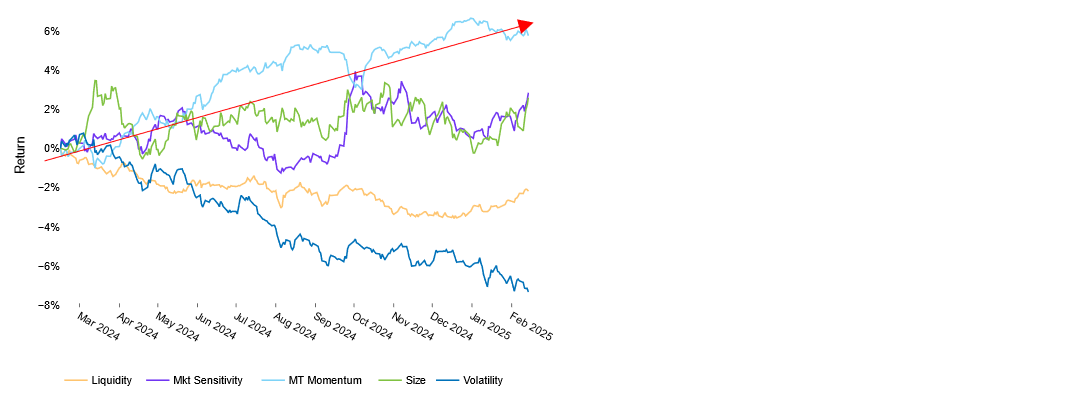
Momentum continues on a tear
Performance of the Medium-Term Momentum factor has been strong in most regions. Despite, or perhaps because of, continued uncertainty, investors are keeping their faith in those stocks that have done well over the past 12 months (excluding the most recent month).
In the US, Developed Markets ex-US and Emerging Markets, Momentum has had the highest one-year return among all market-based factors, and the returns have been relatively steady throughout the last year. In fact, in all three markets Momentum’s volatility is at or near the low end of its 12-month range.
In the US, the yearly return is high relative to historical levels as well. For the 250 days ending February 14 the return of 6.7% is almost twice the long-term median rolling 250-day return. In Developed Markets ex-US and Emerging Markets the rolling figure was above the median for most of 2024, but the return has fallen toward the median more recently for DM ex-US and below the median for EM. Of course, even the median return is positive so the factor is still working as expected.
As noted above, the performance, at least this year, has not been driven by the “usual cast of characters” (i.e. the Magnificent 7), nor has it been concentrated in a few names. Analyzing the longs and shorts separately in the US also reveals that the long positions have contributed more than the shorts to overall performance, so it seems that investors are expecting the winners from the last year to continue to win. But good performance is not just a US phenomenon. And while we hope this performance will continue, we note that historically very good periods have tended to be followed by disappointing returns.
See chart from the February 14, 2025 Equity Risk Monitors
The following charts are not in the equity risk monitors but are available on request.
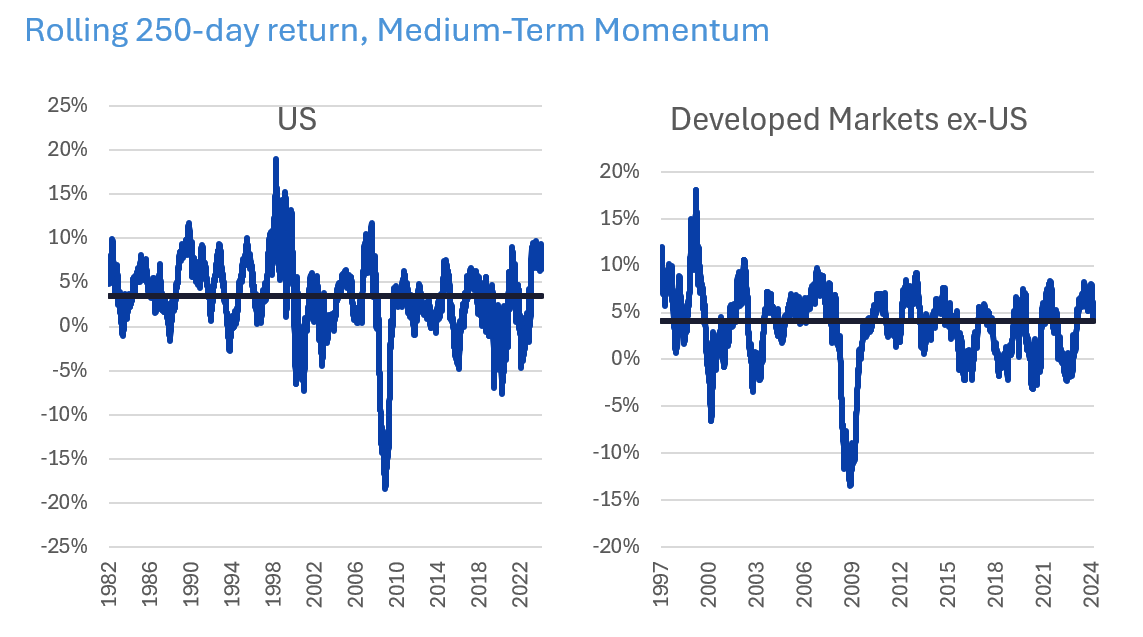
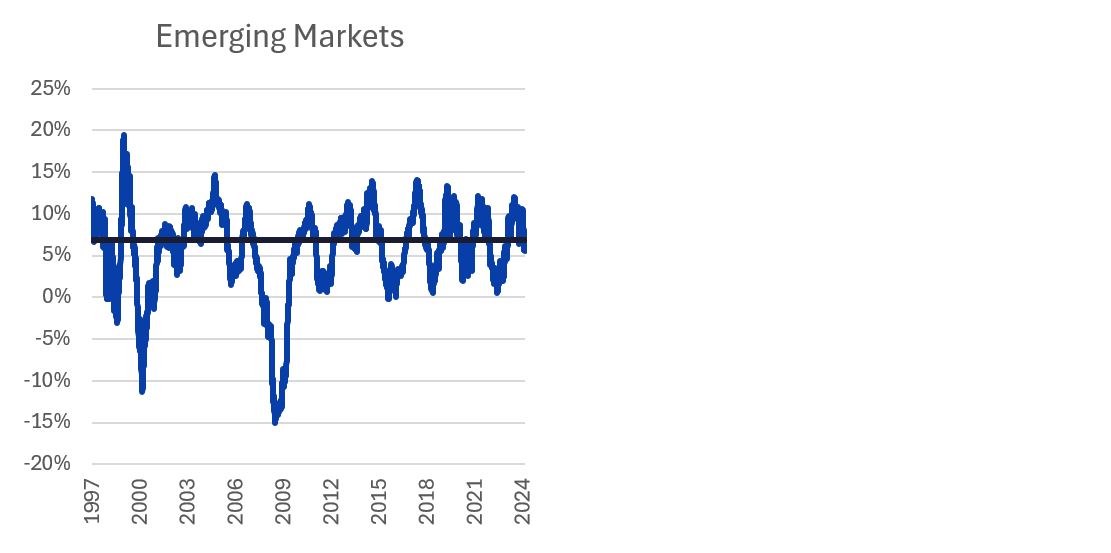
Note: black line represents the long-term median 250-day return. All returns are from version 4 models.
Source: Axioma Risk Models
You may also like


