

EQUITY RISK MONITOR HIGHLIGHTS
WEEK ENDED JANUARY 31, 2025
Axioma Monitor: Risk Tech stocks continue to shake US market amid mixed economic signals; Increased divergence brings down US market risk; Canada and Mexico’s markets and currencies retreat as trade war intensifies
Tech stocks continue to shake US market amid mixed economic signals
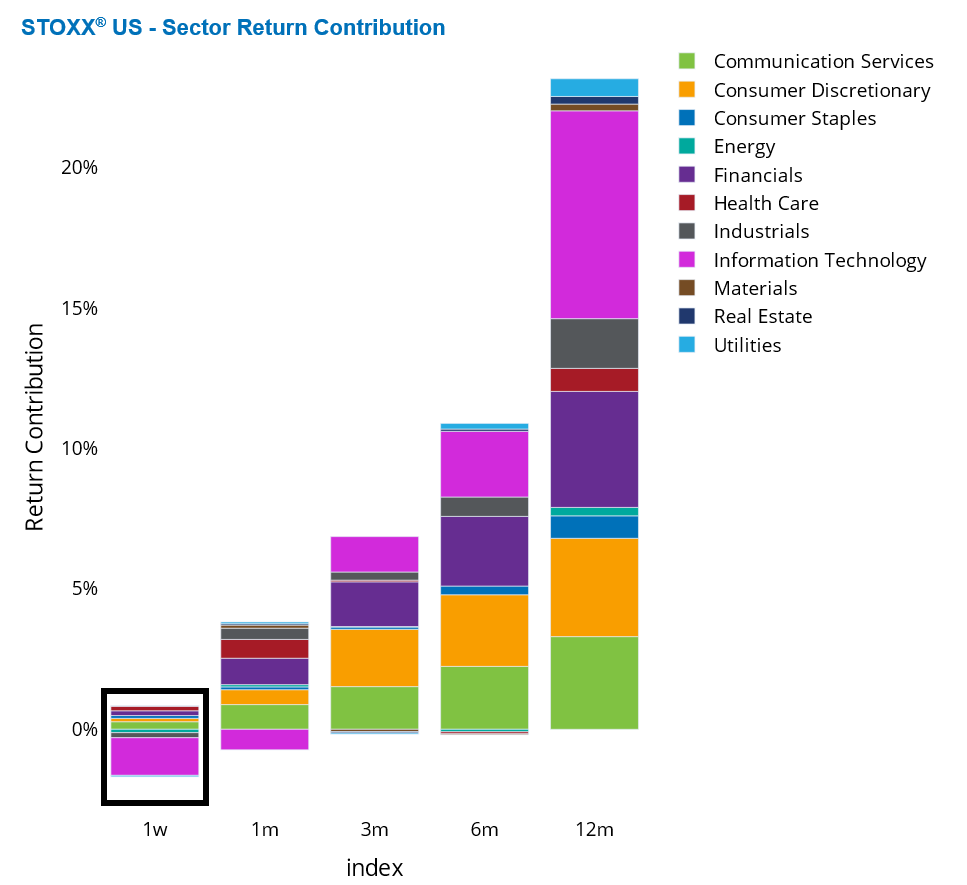
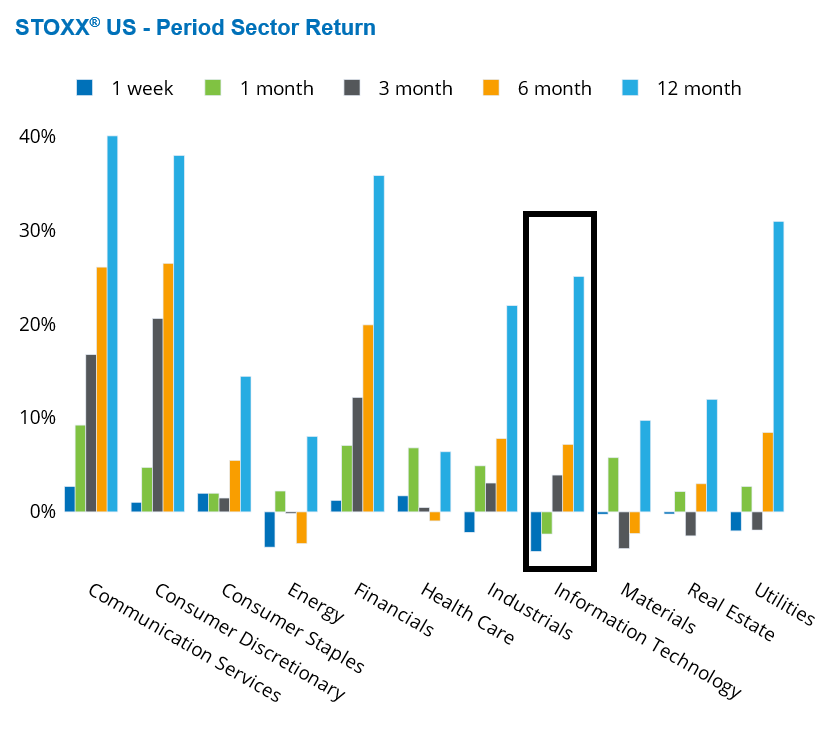
Technology stocks continued to drag down the US market as the release of the new Chinese AI model, DeepSeek, introduced significant instability in the tech sector. Although the Energy, Industrials, and Utilities sectors were all down last week, Information Technology was the main detractor from the STOXX US weekly return due to its dominance in the US market. Info Tech alone contributed 1.34 percentage points to the weekly decline in the US index. However, with seven other sectors up for the week, they offset the decline, resulting in a weekly loss of only 0.87% for the US index.
Despite this, the STOXX US ended January with a positive return of 3%, amid mixed news: the Fed kept rates unchanged on Wednesday, fourth-quarter GDP growth was positive but below expectations, US inflation numbers were higher than targeted, earnings reports were generally positive, and there was the looming threat of new tariffs on imports from Mexico, Canada, and China. Over the four-week period, only the Info Tech sector was down.
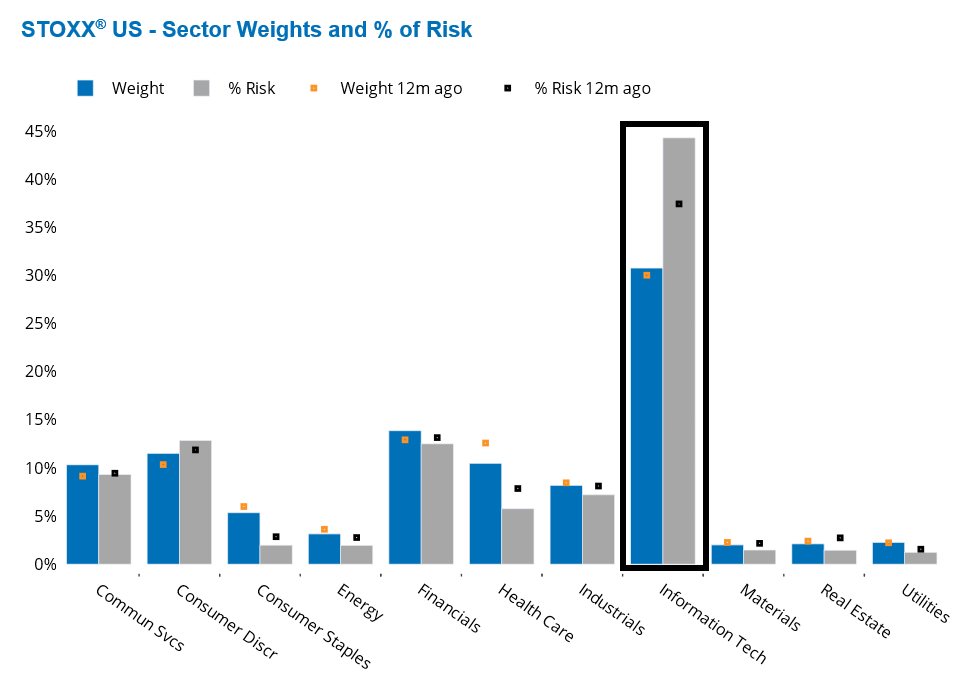
Info Tech’s weight in the STOXX US index is now similar to its level one year ago (30%), but its contribution to benchmark risk, at nearly 45%, is much higher than the tech sector’s weight would suggest and higher than 12 months ago. This means that nearly half of the US market risk is attributable to the tech sector.
For more information on how shocks in the tech sector may affect the US market, as analyzed by various Axioma risk models, refer to the blog post Reverse Stress Testing the DeepSeek Shock.
See graphs from the STOXX US Equity Risk Monitor as of January 31, 2025:
Increased divergence brings down US market risk
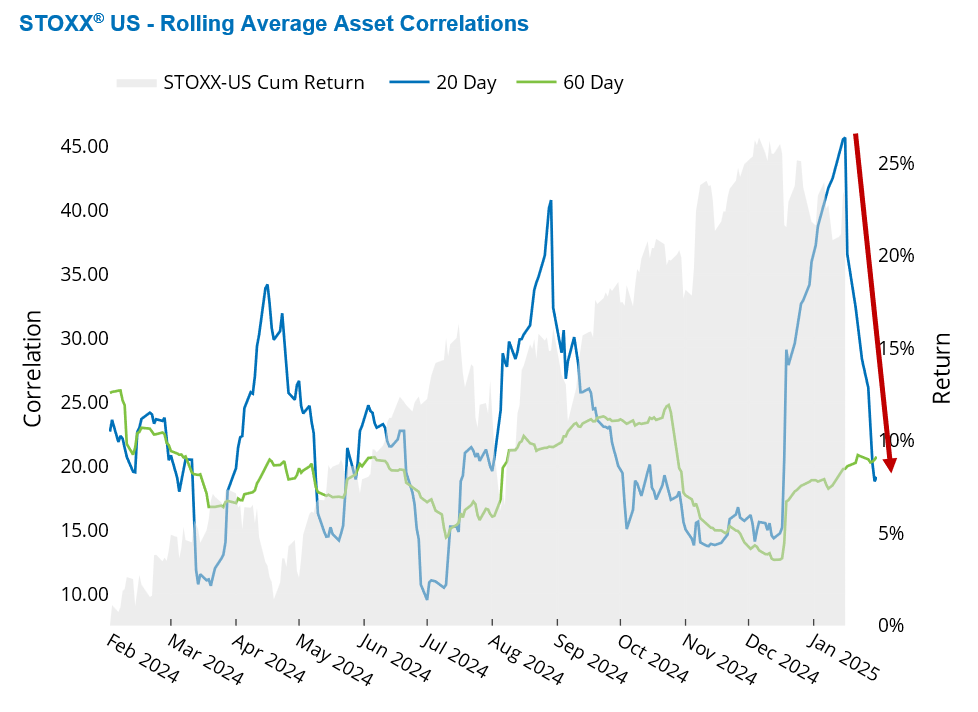
Following the head-spinning volume of new measures introduced by the Trump administration, asset correlations in the US market dropped sharply. After peaking at a 12-month high of 0.45 in mid-January, the average realized 20-day median correlation in the STOXX US index more than halved.
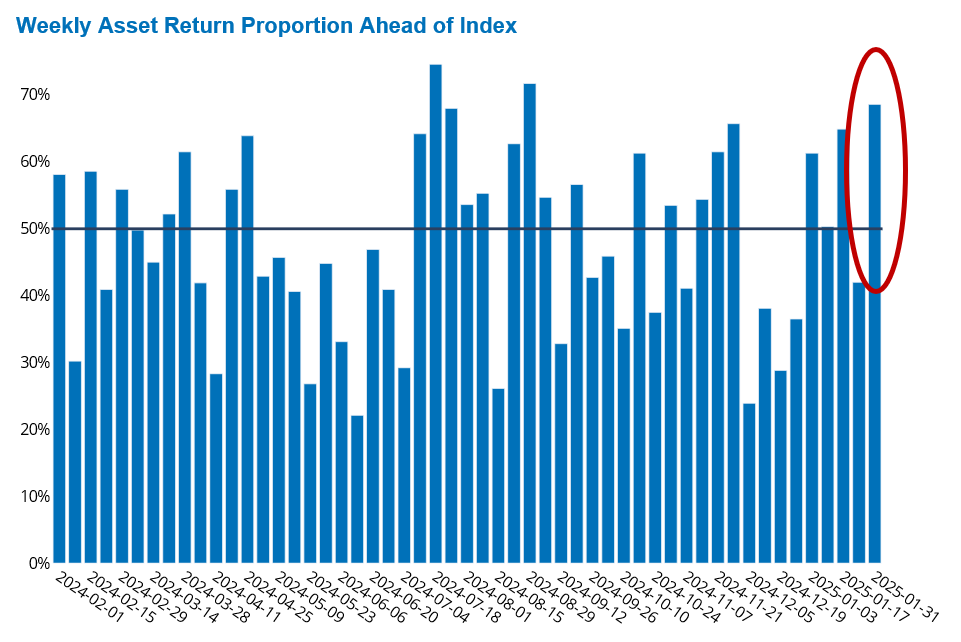
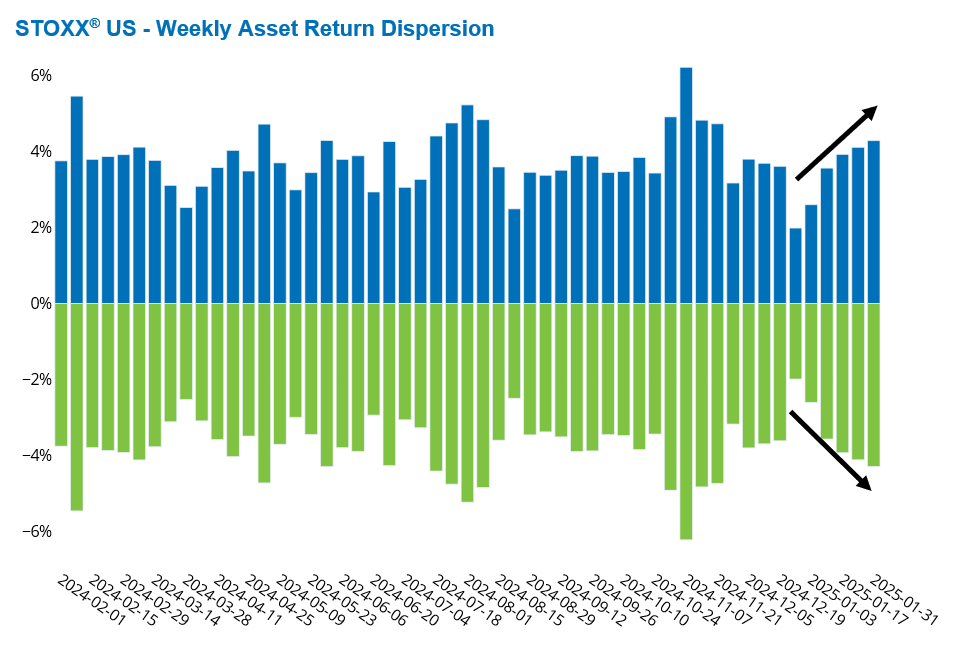
Despite the STOXX US index falling last week, nearly 70% of the names in the index outperformed the benchmark—indicating a widening of the US market breadth. As previously mentioned, a small number of large tech stocks were primarily responsible for the overall index decline. The US market has been also experiencing a widening of the asset return dispersion—the cross-sectional standard deviation of five-day returns—over the past five weeks.
These two statistics reflect the divergence in returns across sectors and types of stocks, suggesting that many active managers may have had the opportunity to outperform the market.
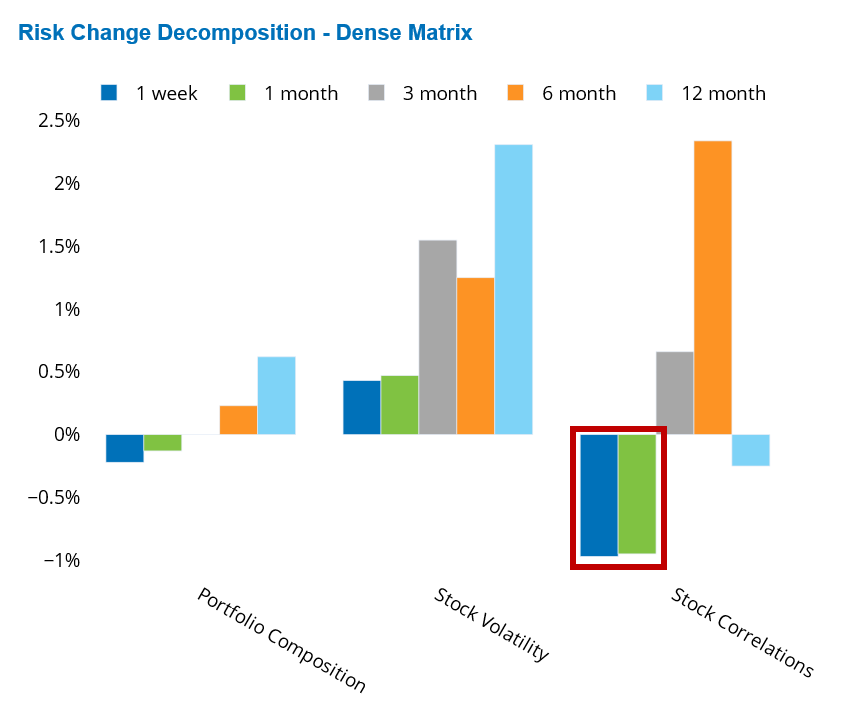
An analysis of the change in risk from a dense matrix perspective reveals that the decline in correlation has been entirely responsible for the reduction in US market risk over the past week and month. In fact, stock volatility increased over these periods, but the decline in correlations more than offset this. The change in the STOXX US index composition also had a minor effect on the overall decline in risk.
See graphs from the STOXX US Equity Risk Monitor as of January 31, 2025:
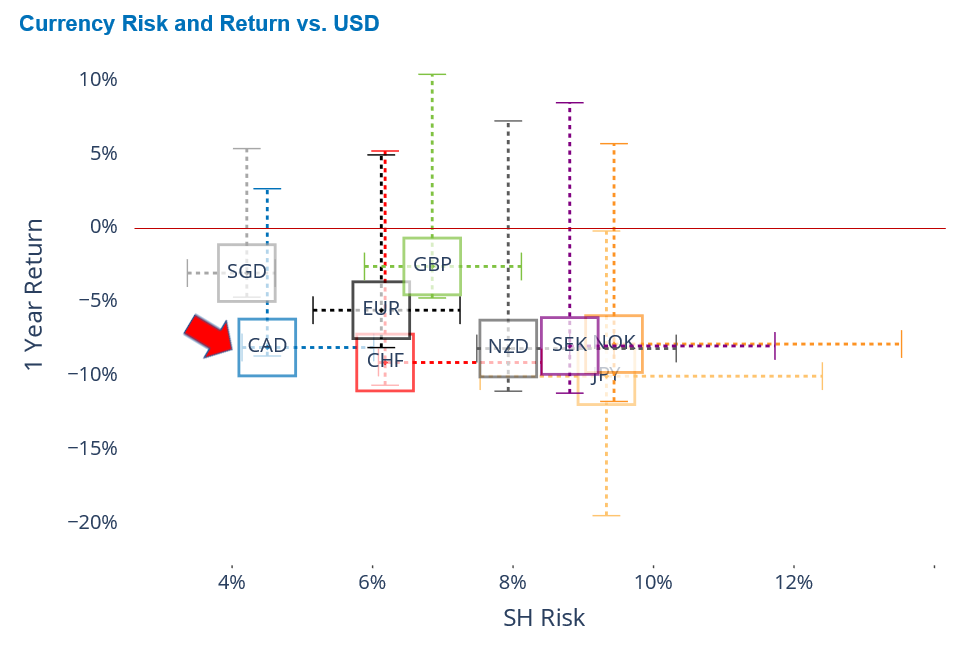
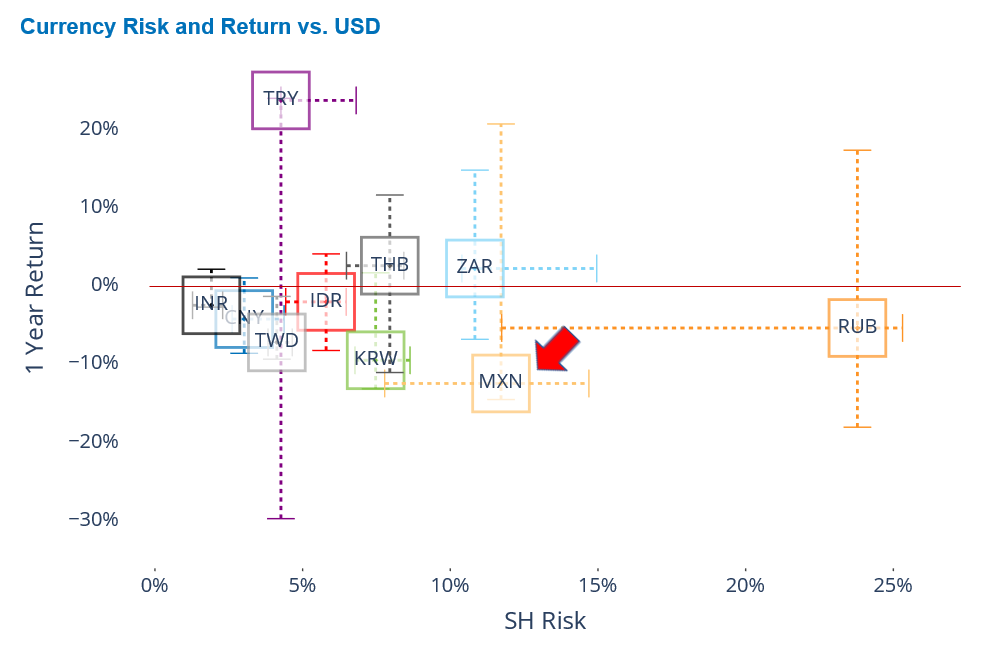
Canada and Mexico’s markets and currencies retreat as trade war intensifies
As the trade war between the US and Canada and Mexico intensified, the two US neighbors’ markets and their currencies retreated last week.
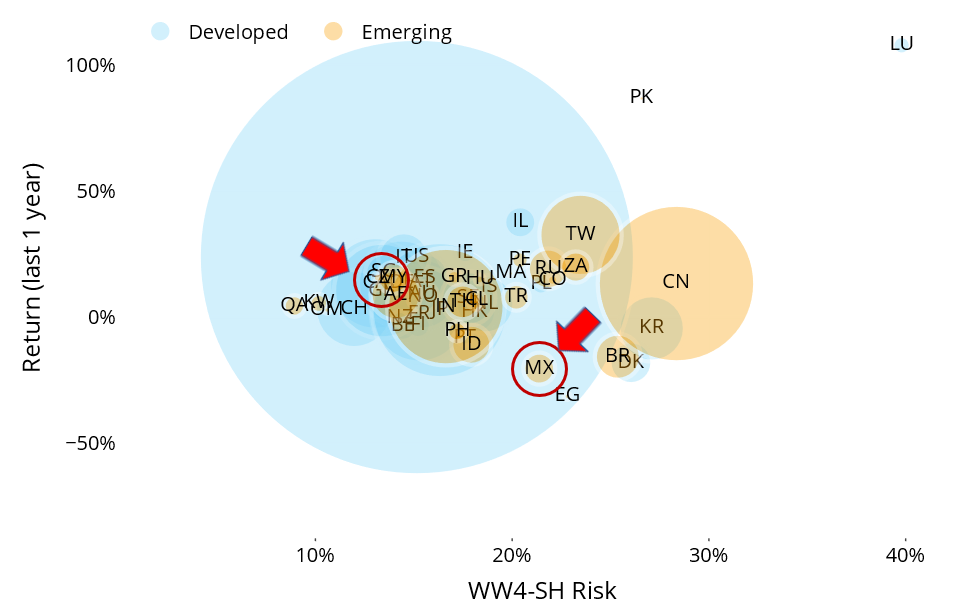
Both the Canadian and Mexican markets began falling after the Trump election in November, with Canada experiencing a 3% loss over the past three months and Mexico an 8% loss over the same period (denominated in US dollars). Despite this, Canada’s one-year return remained positive at 13%, placing it in the middle of its developed market peers. However, Mexico has seen a 20% loss over the past 12 months, lagging behind most developed and emerging countries.
Also the Canadian and Mexican currencies have fallen sharply against the US dollar since last summer. The Canadian dollar (CAD) is now at its lowest point against the greenback since 2003, with an 8% loss over the past year. Among major developed currencies, only the New Zealand dollar, Swiss franc and Japanese yen have suffered larger losses during the same period. Despite the weakening of the Canadian dollar, it remains one of the least risky currencies.
The Mexican peso is the biggest loser among major emerging currencies, with a nearly 13% loss over the past year. The peso’s risk has only been surpassed by that of the Russian ruble, as measured by the Axioma Worldwide fundamental short-horizon model.
See graph from the Equity Risk Monitors as of January 31, 2025:
See graph from the STOXX Developed World Equity Risk Monitor as of January 31, 2025:
See graph from the STOXX Emerging Markets Equity Risk Monitor as of January 31, 2025:
You may also like


