The new Axioma US Equity Trading Model
A crisp view of ultra-short term risk – and longer-term implications
The GFC, COVID and August 2024 “flash crash”: What did the Trading Model see?
Author
Melissa R. Brown, CFA
Head of Investment Decision Research
Note: this is an update to a piece originally written in 2021 when we introduced version 5 of the US trading-horizon models. This update covers the new 5.1 version models.
The latest version (5.1) of the Axioma US Equity Factor Risk Model helps portfolio managers with shorter investment horizons to better understand and manage their risk. That said, it is not only for traders. When the market abruptly and sharply changes direction, or when there is a substantial rotation from one set of stocks to another, this new Trading Model picks up the associated volatility much more quickly. Even users of medium-horizon models can leverage the Trading Model to get a better handle on short-term portfolio risk and its implications.
To illustrate this, we first look at US equity market volatility during three periods of crisis: the Global Financial Crisis, the onset of the COVID pandemic and the very recent and short-lived volatility spike that was the result of a weaker-than-expected jobs report combined with an unwinding of the carry trade in Japan. The quicker reactions of the trading-horizon model relative to the short- and medium-horizon variants of the Axioma fundamental equity models (also in the version 5.1 US equity model suite) are evident in each case.
Global Financial Crisis
We begin by examining the period from the end of July 2008 through the end of April 2009, a time dominated by the Global Financial Crisis. Although there were clear signs of trouble as early as 2006, the “official” onset of the crisis is usually associated with the failure of Lehman Brothers in September 2008. In Figure 1 below, we see that the three model variants (trading, short and medium) had similar risk forecasts through August of 2008 and reached a near-term low at the end of that month. But on August 26, predicted risk as reported by the trading-horizon model rose almost 11% from the prior day (14.6% to 16.2%), commencing its long upward path through October, pointing to the underlying crisis bubbling under the surface more quickly. Risk of the short- and medium-horizon variants rose much more slowly. By September 23, all models had seen substantial increases from the recent lows, with medium-horizon volatility up 21% from September 3 to September 22, short-horizon up 48% from September 3 to September 22 and trading-horizon up 90% from August 25 to September 24. Using a comparable period of August 25 to September 24, risk rose 30% and 10% for short-horizon and medium-horizon respectively.
Just as important, as the market settled down in November, at least temporarily, trading-horizon risk reflected the decrease in volatility much more quickly, dropping by almost half from the peak by early January 2009, and falling below that of the other two variants. The market dropped substantially once more from January through early March, and trading-horizon risk once again recognized the renewed volatility (although it did not reach its prior peak). It subsequently dropped quickly after the market bottomed out in early March. By the end of April, with the market recovery in full swing, risk forecasts from each of the models were once again much more in line with each other.
Figure 1: The Global Financial Crisis (2008-2009): Trading, Short and Medium Horizon forecasts
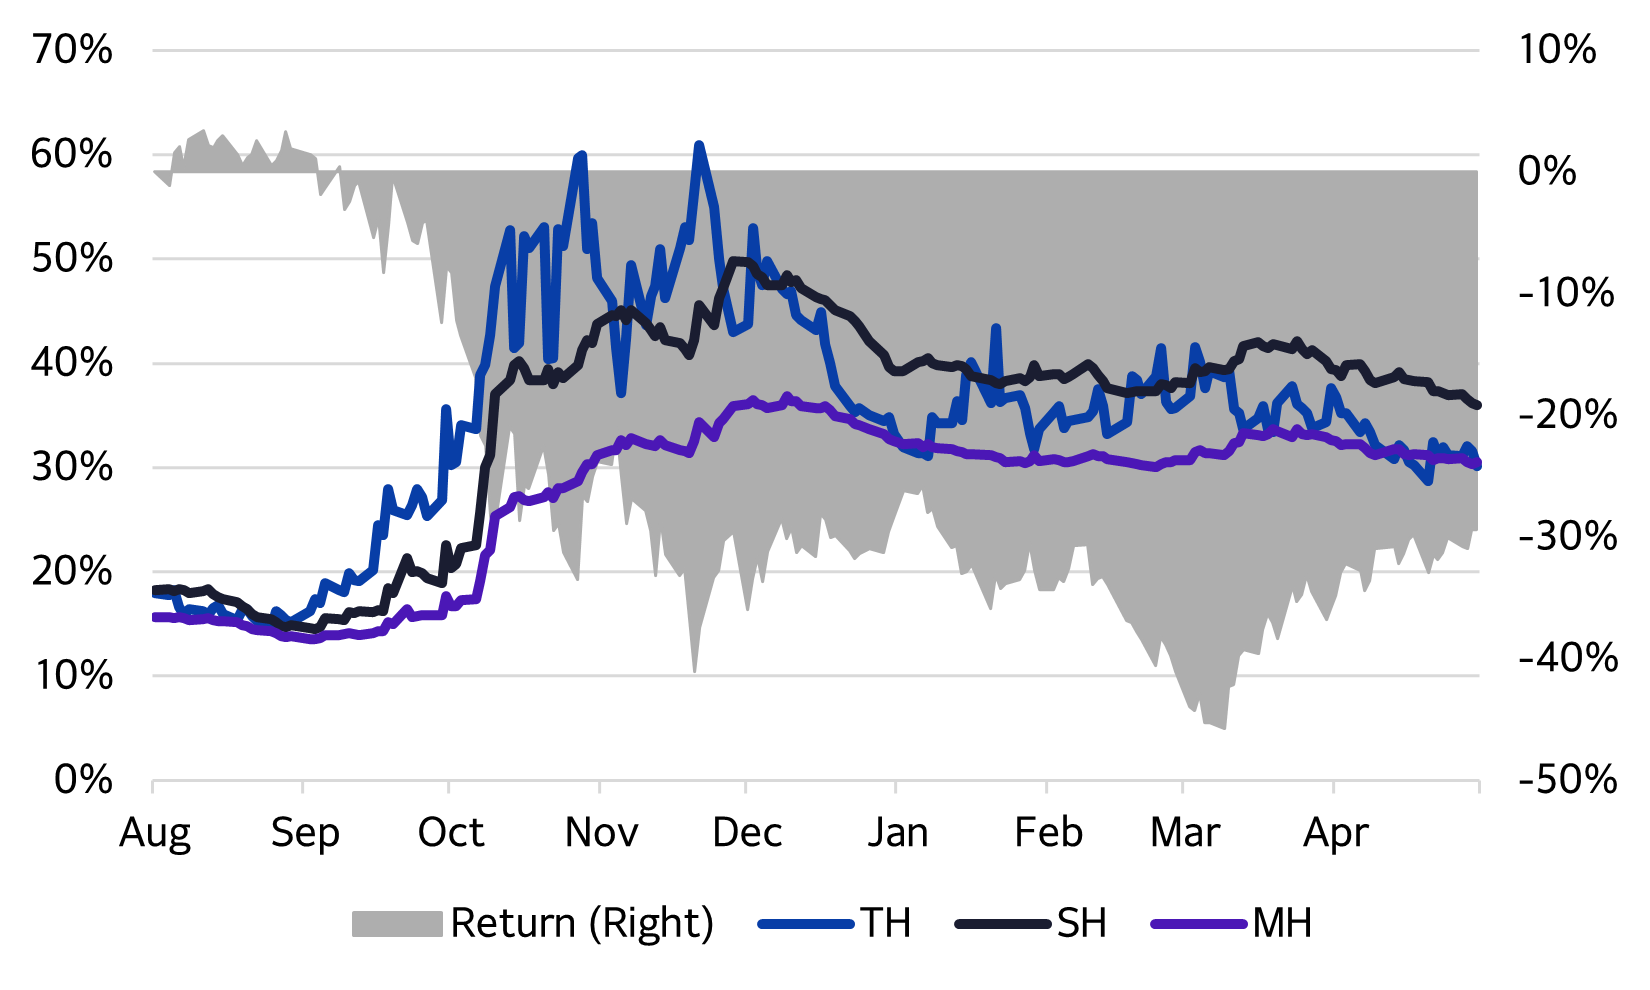
Source: Axioma US Equity Factor Risk Models v5.1
COVID First Wave
Here we looked at full-year 2020 to illustrate the calm before the COVID storm, the impact of the sharp but short-lived decline in stock prices associated with the lockdowns, and the subsequent market recovery.
2020 got off to a quiet start. In fact, predicted volatility from all models was near historical lows, as few grasped the enormity of the oncoming crisis. However, by February 20, as the news turned bad, the market started to plunge. On March 13 alone, US stocks were down about 12%, the worst one-day return in at least 20 years. On March 16, predicted volatility from all three model variants saw some of the largest one-day increases in model history, but the increase in the Trading Model volatility of more than 40% dwarfed the 23% and 19% increases of the short-horizon and medium-horizon model forecasts, respectively.
Interestingly, that day saw the peak in risk for the trading-horizon model, while the other two continued to climb for another couple of weeks, even as the Fed announced a wide array of plans that included lowering the target fed funds rate, keeping rates near 0%, continuing massive quantitative easing, backstopping money market funds, and on and on. During that period, the equity market recovered, erasing all of its March losses by early June. By then the predicted risk according to the Trading Model had fallen to a third of its peak and was about 14 percentage points lower than that of the short-horizon forecast and almost 7 percentage points lower than the medium-horizon variant. A substantial market decline on June 10 led to a quick jump in trading-horizon risk, but in general it continued to decline through August. Risk from the other models also declined. Their declines were much slower, albeit without the periodic spikes we saw in the trading-horizon model after big down days. We would also note here that, as usual, markets tend to drop quickly but rise slowly. Market gains generally do not, therefore, result in risk spikes.
Figure 2: COVID 2020: Trading, Short and Medium Horizon forecasts
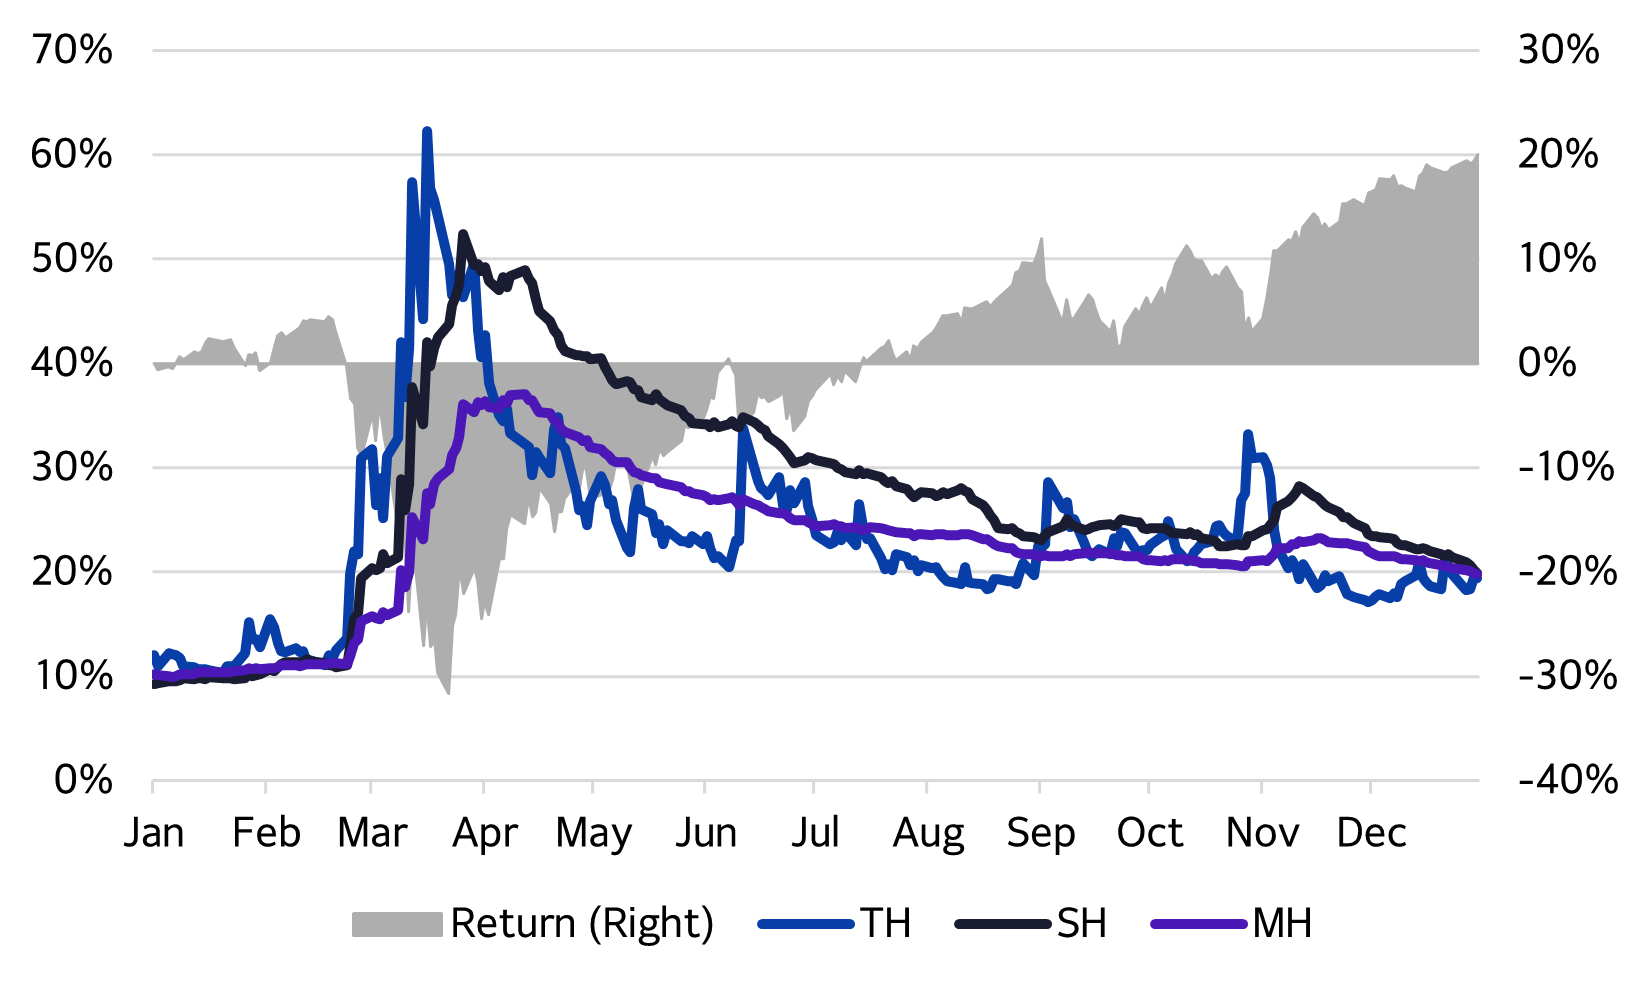
Source: Axioma US Equity Factor Risk Models v5.1
August 2024 Jobs Report “flash crash”
Finally, we looked at the recent short-but-sharp decline that resulted from the early-August report that unemployment was higher than expected and had triggered the “Sahm rule”, which predicted the US economy was now in a recession. Once again, forecasts from all three model variants had been almost identical, although the trading horizon model had started to rise. Even prior to the August 2 report the market had been choppy, as AI concerns started to surface. Just prior to the jobs report, on July 31, the Bank of Japan announced what could have been viewed as a small rate hike. As the market absorbed the impact of the small increase, global markets were sent into a tailspin as investors started to cover their carry trades based in yen. Over a two-trading-day period the US market fell about 5%. The trading horizon model forecast jumped more than 60%, from 19.3% to 31.3%. While the other two models’ increases were much more subdued. Predicted risk according to the Axioma Trading Model peaked on August 6th, and was back in line with the others by August 15th.
Figure 3: 2024 Jobs Report “flash crash”: Trading, Short and Medium Horizon forecasts
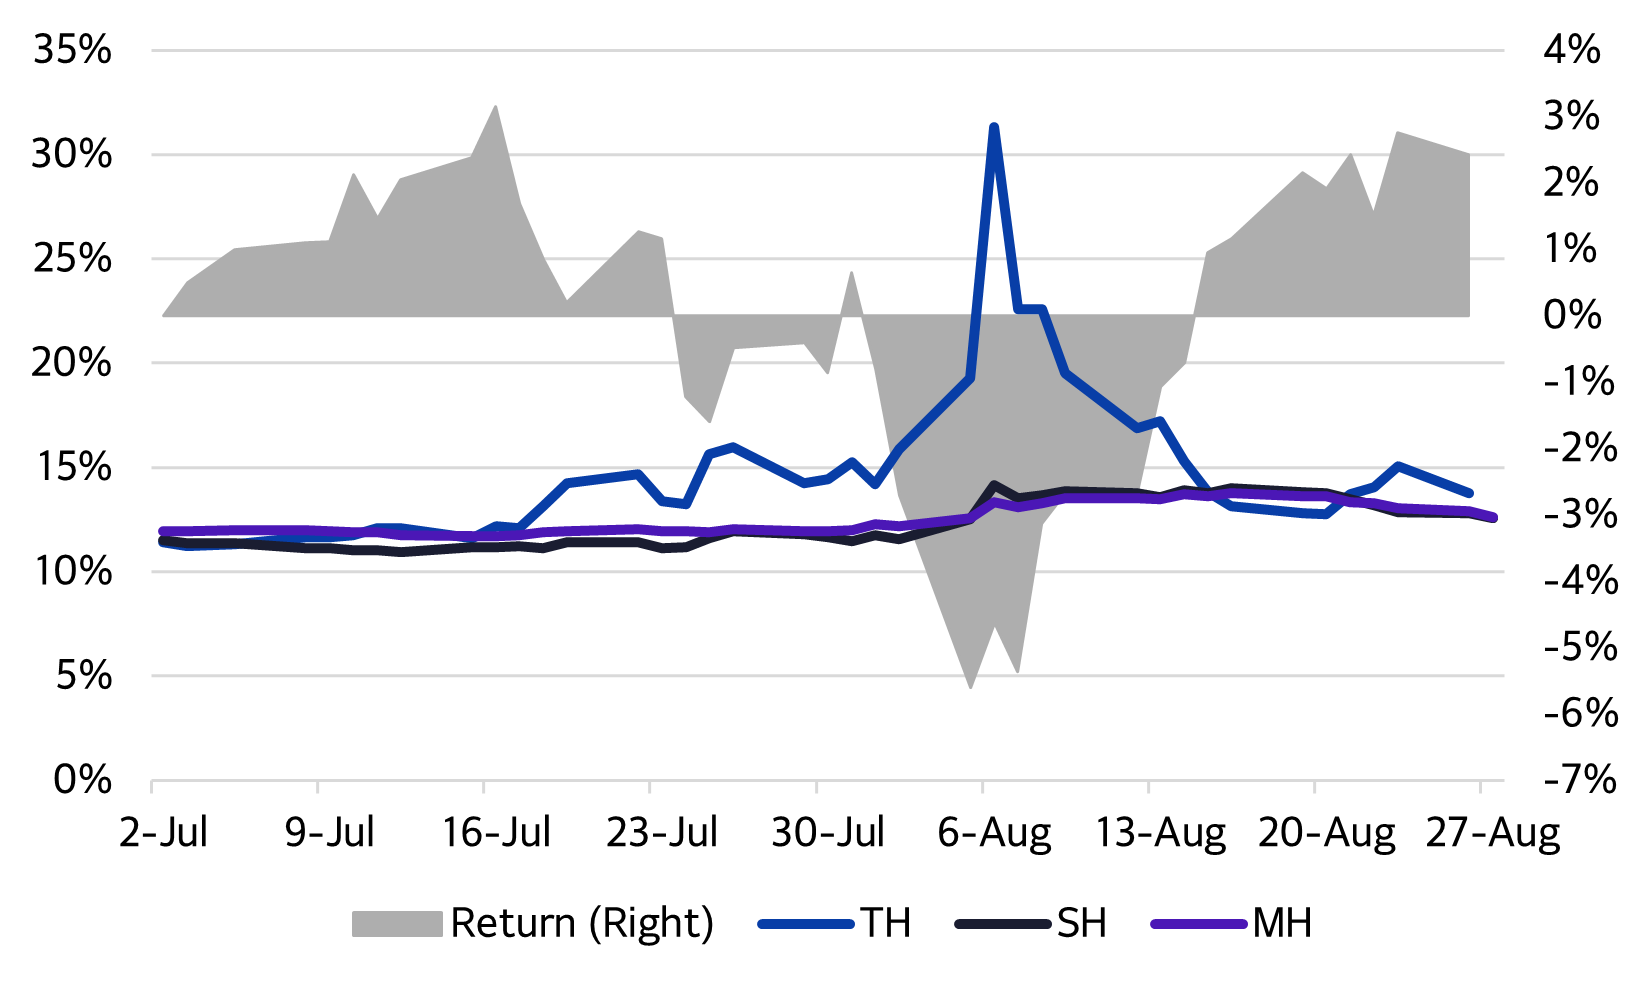
Source: Axioma US Equity Factor Risk Models v5.1
Why is parsing the differences in risk model forecasts useful even for investors with longer horizons?
Consider the following:
- As we have often noted about the short-horizon model, it tends to be a leading indicator vis-à-vis the medium horizon. We can view the trading-horizon model in the same way: as trading-horizon risk changes substantially, the models many of our clients use to rebalance their portfolios are likely to follow on its heels. Some may not want to trade “today” when they know they will have to trade again “tomorrow” because risk will have increased, and they will need to bring risk in line with budget.
- While longer-horizon models work extremely well in “normal” markets, investors may want to turn to our new US Equity Trading Horizon Model to understand what is happening to their portfolios in times of crisis, as we have illustrated above. Even if they don’t use the model to trade, just understanding the sources of ultra-short-term risk and return can be extremely helpful in making investment decisions and explaining results to clients.
- Although we have not discussed the additional components of the new US Equity Trading Horizon Model on top of what is included in the other horizon models, some of those factors may help with more quickly identifying opportunities or threats to a portfolio, even versus the original version 5 trading model. For quantitatively driven investors, these factors can easily be added to an optimization, even if the risk target is based on a different horizon model.
For more information about the Axioma Equity Factor Risk Model – Trading Horizon, visit www.simcorp.com/tradingmodel
"Even if they [managers] don’t use the [trading] model to trade, just understanding the sources of ultra-short-term risk and return can be extremely helpful in making investment decisions and explaining results to clients."
Request a demo
Related content