
AXIOMA ROOF™ SCORE HIGHLIGHTS
WEEK OF JULY 8, 2024
Potential triggers for sentiment-driven market moves this week
- US: CPI and PPI data for June, consumer confidence report, and the semiannual testimony of Fed Chair Powell to the Senate Banking Committee. Earning reporting season kicks-off with big banks, JPMorgan, Citigroup, Wells Fargo and Bank of New York Mellon, as well as PepsiCo.
- Europe: French and UK election results, final inflation data for Germany, France, and Spain, and Germany’s trade surplus data.
- APAC: China trade balance for June, inflation rate, PPI, and new yuan loans data. Australia’s business and consumer confidence data.
Insights from last week's changes in investor sentiment:
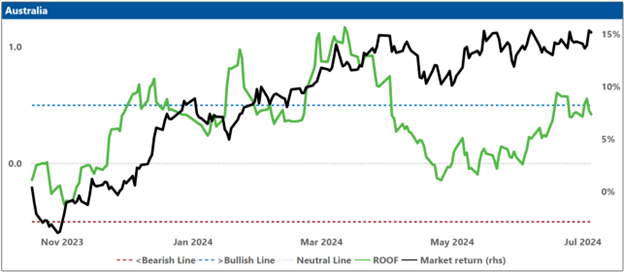
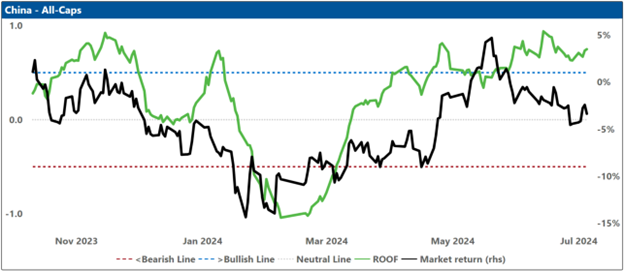
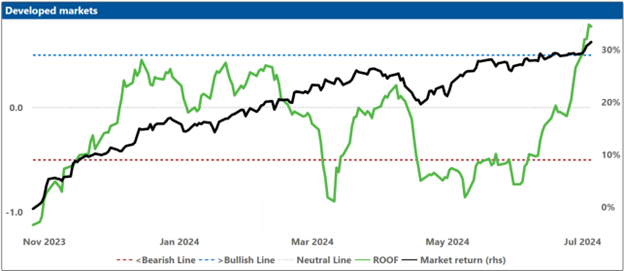
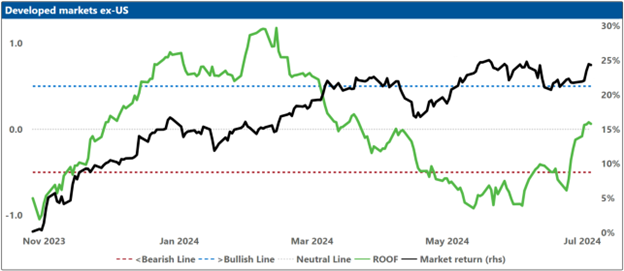
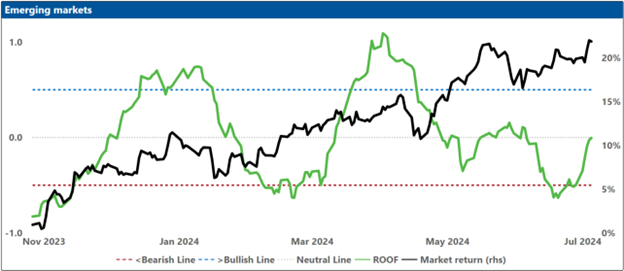
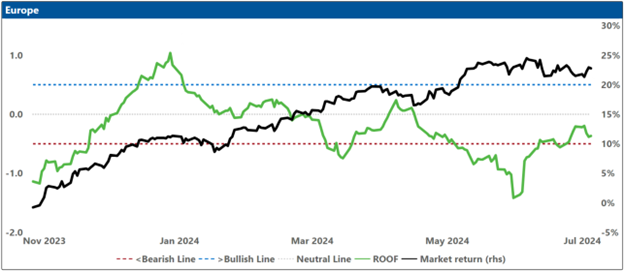
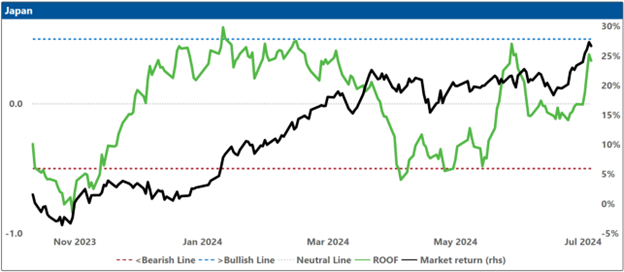
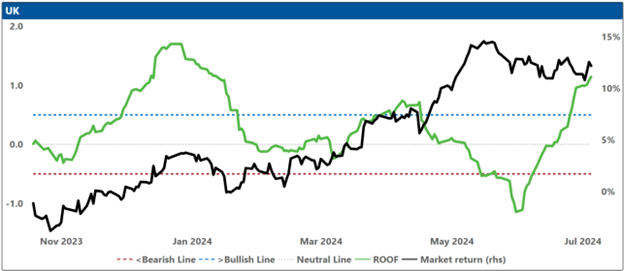
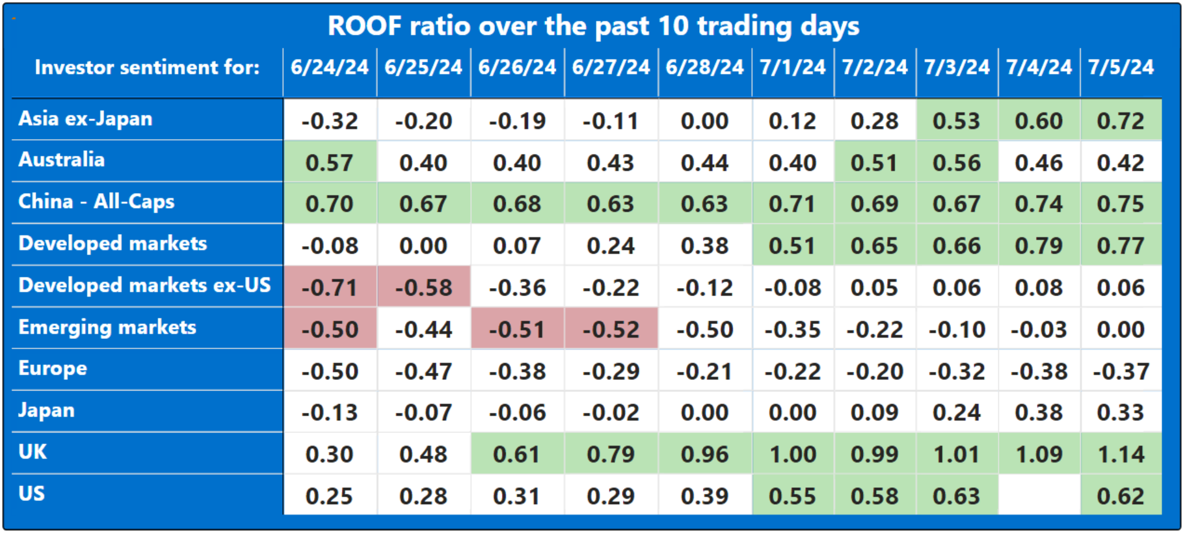
Investor sentiment experienced a notable improvement last week, with the mood in five out of the ten markets we monitor (Asia ex-Japan, China, Global Developed Markets, the UK, and the US) reaching bullish levels. Sentiment in Australia and Japan stayed positive, whereas investors in Global Developed ex-US Markets and Global Emerging Markets maintained a neutral stance. Conversely, European investors were the only group to hold on to a negative sentiment, likely influenced by the as-of-then unknown results of the British and French elections.
It has been my horreur these past two weeks to report on a dysfunctional French legislative election. I would like to tell you that this story has a happy ending, but the best I can do is say it has one that is happier than it’s beginning. French President Emanuel Macron will now be looking for “les mots justes” to explain the disastrous (and somewhat undemocratic) results of his “faux pas” in calling for snap elections and narrowly avoiding a “coup de grace”. He may have prevented angry voters from giving the far right “carte blanche” in governing the country but he is well “en route” to be a President in name only until he must bid us “adieu” in 2027. “C’est la vie”.
Now that elections in Europe, the UK, and France are “derrière nous”, the rest of the summer will be dominated by US politics with the two party’s national conventions in July and August as well as the second Presidential debate in September (note to ABC: Give Biden a safe word!). While the Republicans are closing ranks behind their presumptive nominee, the Democrats are busy trying to answer the philosophical tree-in-the-forest questions: When Biden is alone in a room, is there anyone there? A red wave in November would not only put Donald Trump back in the White House, it will also convert the United States Congress into his wholly-owned subsidiary. Historically, markets have shown a preference for a divided government, and investors will be closely monitoring changes in voters’ mood for indications of such an outcome in the upcoming November elections.
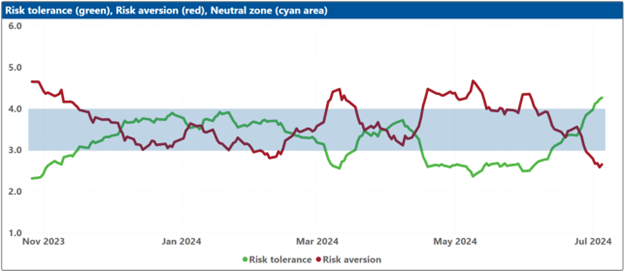
Economic data continues to be soft enough to teach, but not weak enough to frighten, leading investors to continue betting on a Fed rate cut. Globally, the single biggest influencer of a positive sentiment has been the further decline in market risk from what was already below-average levels at the start of the summer. This week kicks-off the Q2 earnings reporting season and investors will focus on company-specific news instead of macro, political, or geopolitical news, unless the later takes a drastic turn for the worst. The resulting increase in dispersion that comes from diverse earning performance should ensure that returns continue to compound faster than risk ossifies.
Note: green background = bullish, red background = bearish
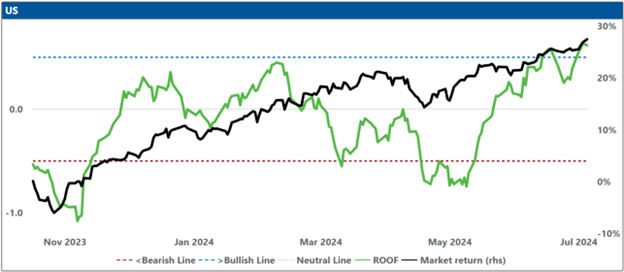
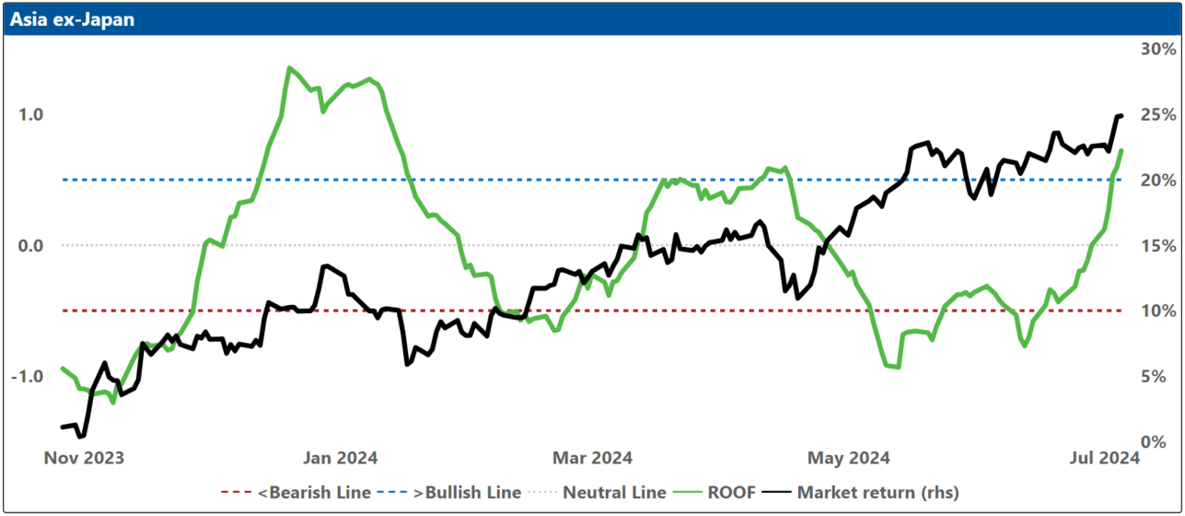
Changes to investor sentiment over the past 180 days for the markets we follow:
How to Interpret These Charts:
Top Charts:
The top charts illustrate the ROOF ratio, which represents investor sentiment. This ratio is depicted in green on the left axis, while the cumulative returns of the underlying market are shown in black on the right axis. Key reference lines include:
- A horizontal red line at -0.5 (left axis), marking the threshold between negative sentiment (-0.2 to -0.5) and bearish sentiment (< -0.5).
- A horizontal blue line at +0.5 (left axis), indicating the boundary between positive sentiment (+0.2 to +0.5) and bullish sentiment (> +0.5).
- A horizontal grey line at 0.0 (left axis), around which sentiment is considered neutral (-0.2 to +0.2).
Bottom Charts:
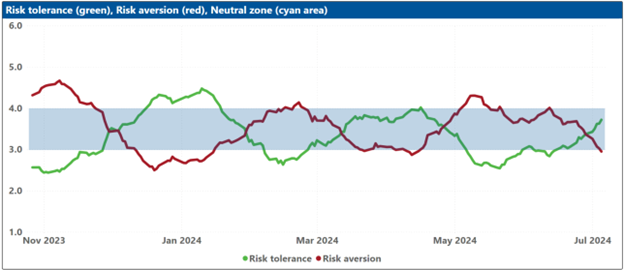
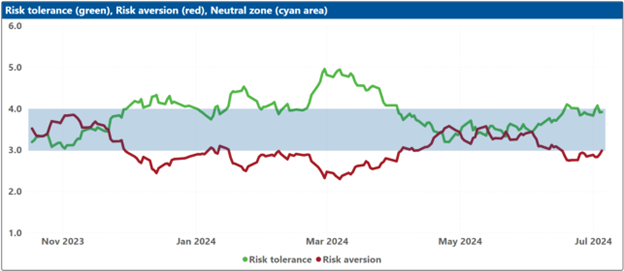
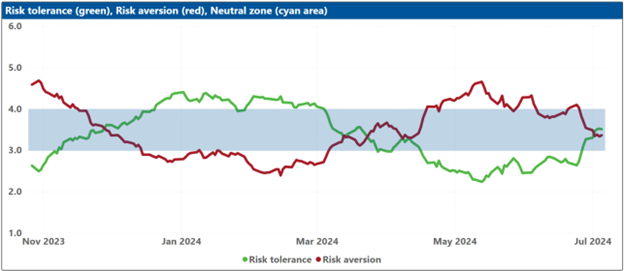
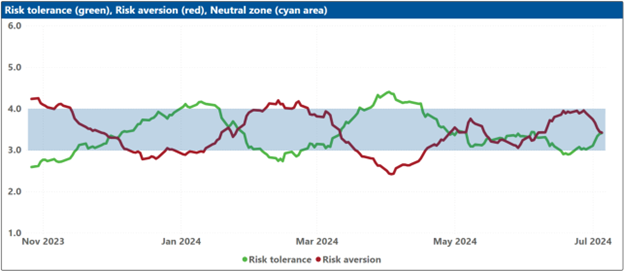
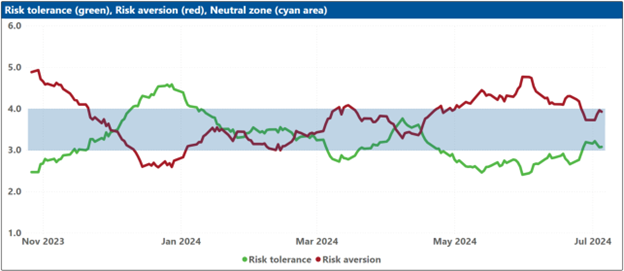
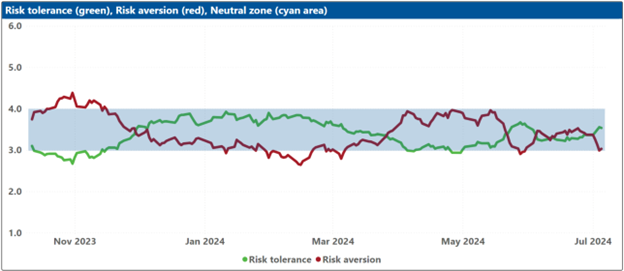
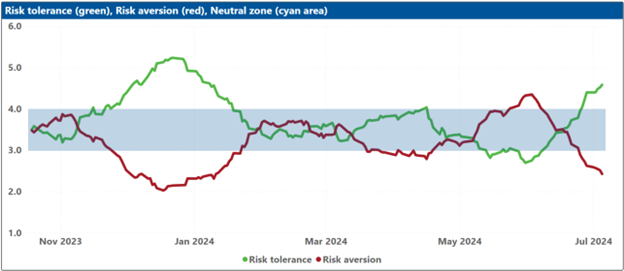
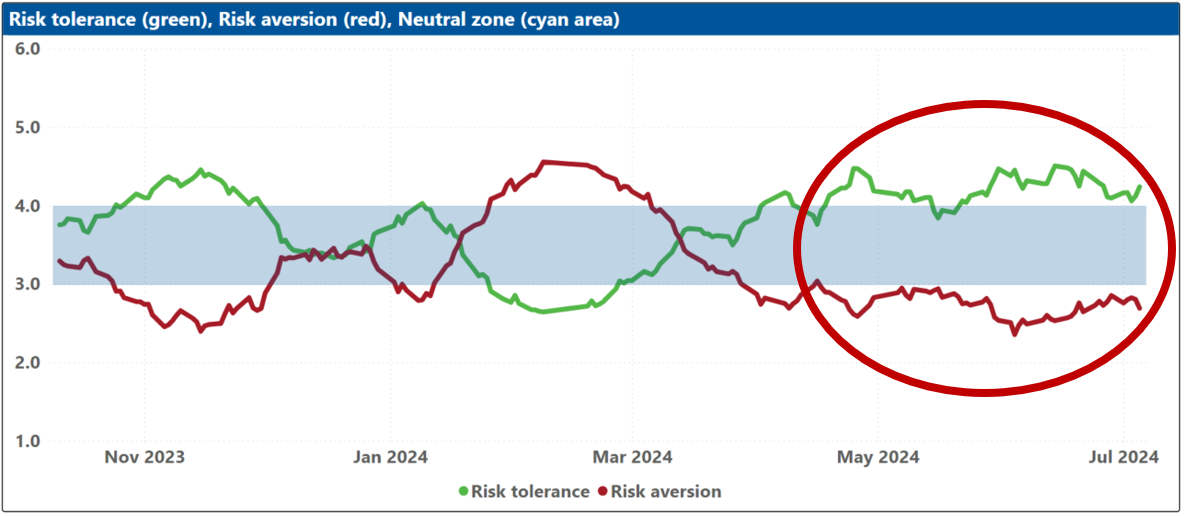
The bottom charts display the levels of risk tolerance (green line) and risk aversion (red line) within the market, representing investors' demand and supply for risk, respectively. Key insights include:
- When risk tolerance (green line) exceeds risk aversion (red line), more investors are willing to buy risk assets than there are investors willing to sell them at the current price. This scenario forces risk-tolerant investors to offer a premium to entice more risk-averse investors to trade, thereby driving markets upward.
- Conversely, when risk aversion (red line) surpasses risk tolerance (green line), the market dynamics reverse.
The net balance between risk tolerance and risk aversion levels is used to compute the ROOF ratio shown in the top charts, reflecting the sentiment of the average investor in the market.
Blue Shaded Zone:
The blue shaded zone between levels 3 and 4 for both indicators signifies a reasonable balance between the supply and demand for risk in the market. When both lines remain within this blue zone, the market is considered stable. However, when both lines move outside this zone, the significant imbalance in demand and supply for risk can lead to overreactions to unexpected news or risk events.
