
EQUITY RISK MONITOR HIGHLIGHTS
WEEK ENDED NOVEMBER 29, 2024
- Some US and European Style Factor November returns were large in magnitude, that was less true in Developed Markets ex-US
- Volatility increased and factor correlations in the US changed, but few changes were large
As we just ended a month in which we saw quite a bit of see-sawing or outright changes in direction for style factors, this week’s highlights will focus on some of our style factor observations for November.
As we have written recently (see Equity Highlights November 8 and November 15, MAC Highlights November 8, ROOF highlights November 18 and this blog post), the US election impacted global markets, bringing an uptick in volatility along with some higher-magnitude-than-expected factor returns, most notably in the US. Some factors also experienced a substantial increase in volatility, and a few factor-factor correlations were also somewhat higher or lower than they were a month earlier, suggesting that active risk may have changed.
Some US and Europe November returns were large in magnitude, less true in Developed Markets ex-US
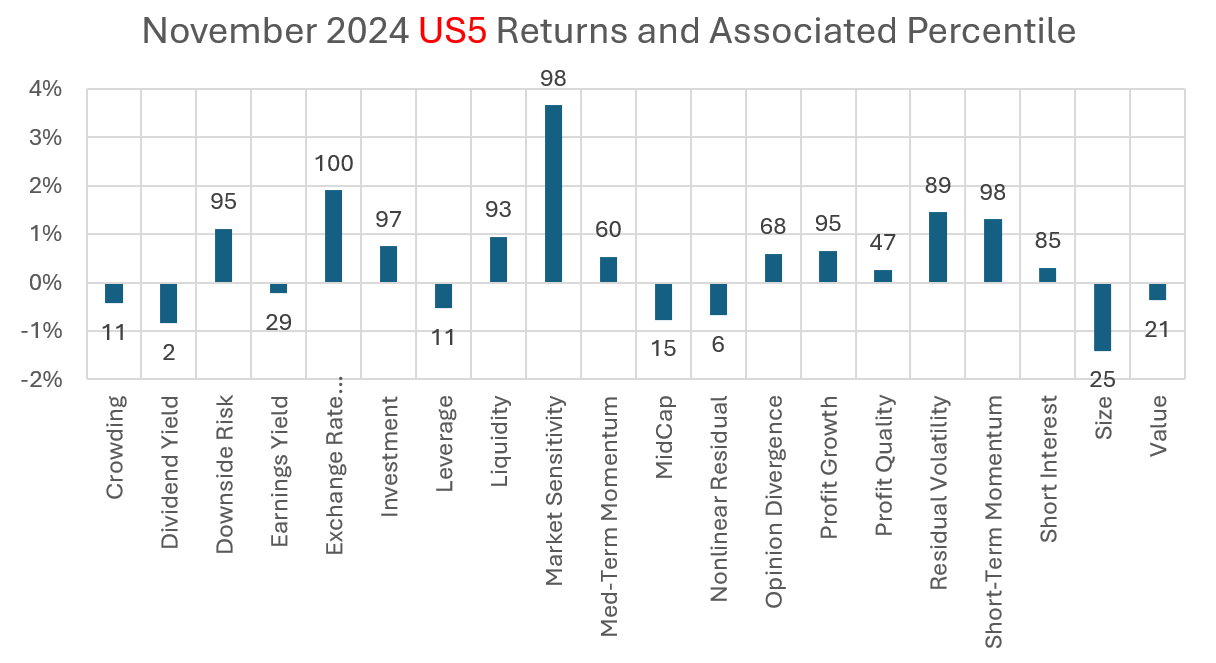
November saw several outsized style factor returns in Axioma’s US5 Fundamental Risk Model, while outside the US (with the exception of in Europe) factor returns were more in line with expectations. In particular, according to the US5 model, both Market Sensitivity and Exchange Rate Sensitivity had among their highest returns in the 40+ year history of the model, as compared with average monthly returns close to zero. Downside Risk, Residual Volatility and Short-Term Momentum, all with negative average monthly returns, were instead unusually positive. Crowding had a down month, defying expectations that crowded stocks tend to see positive returns while Short Interest saw a slightly positive return, suggesting some short covering was going on during the month. And after three months of strongly positive performance, Size turned in a higher-than-average negative return that fell just into the bottom quartile versus history.
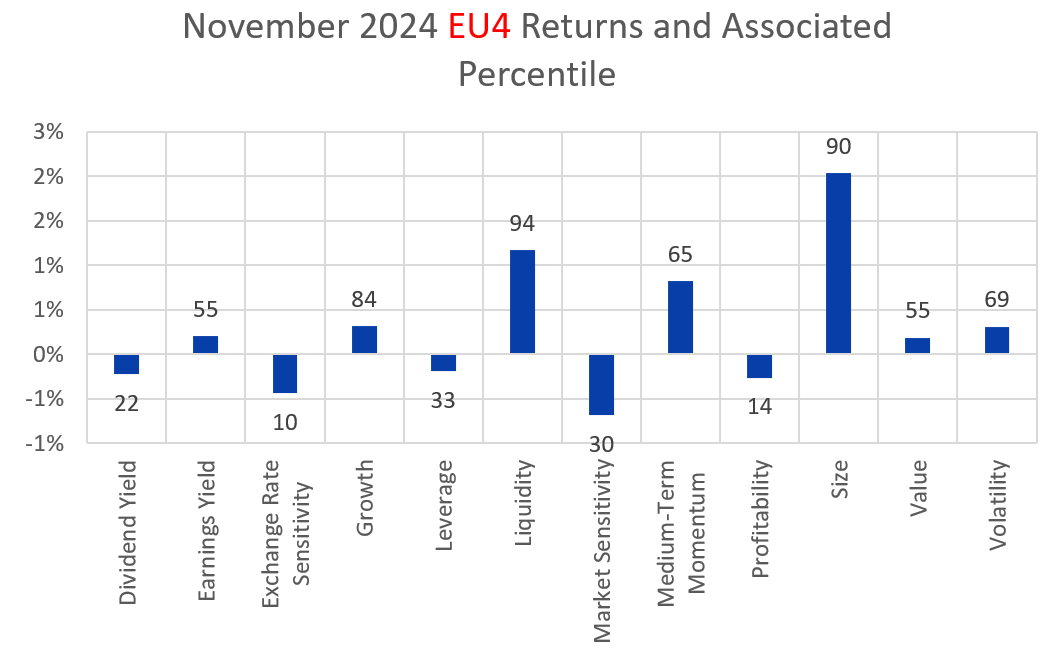
Factor returns in Europe were just slightly more muted. Exchange Rate Sensitivity saw a bottom-decile return as the dollar strengthened, and Profitability, positive on average, produced a negative return in the 14th percentile. In contrast to the US, Market Sensitivity’s performance was negative, and Size had a 90th percentile positive return.
For both Europe and the US higher Liquidity commanded a premium, with the factor return in the top decile relative to history in both cases.
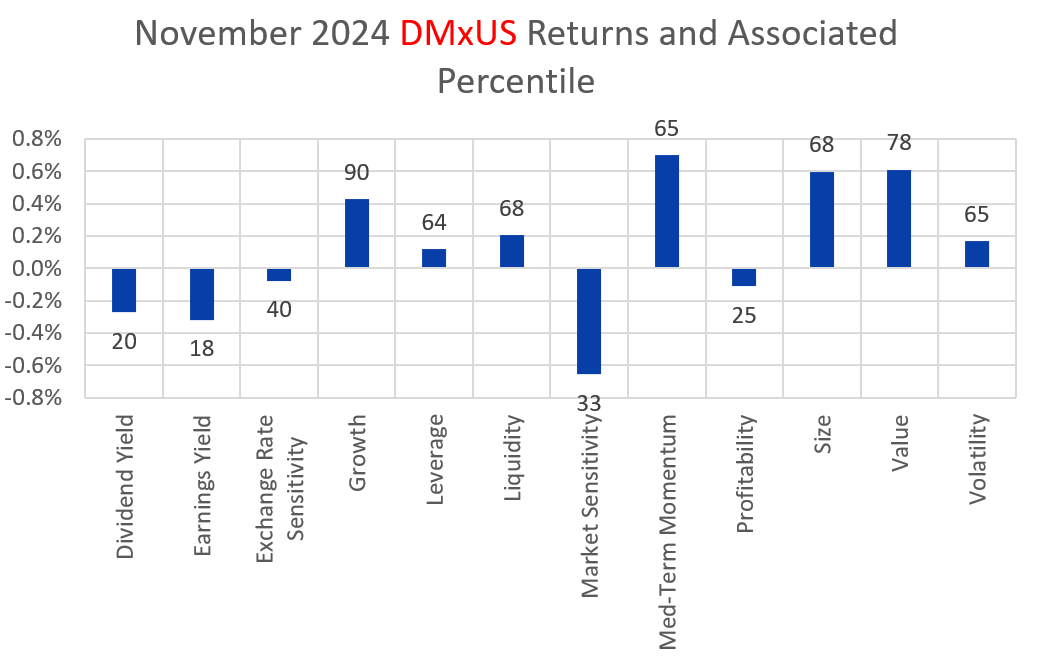
In the broader Developed Markets ex-US model, factor returns were much more muted, with only one factor, Growth, seeing a return in the top decile relative to history and no factors with bottom-decile performance. Unlike in the US, but similar to Europe, investors shunned high Market Sensitivity and sought larger names. They also looked for better Value. Medium-Term Momentum had a good, but not spectacular month in the US, Europe, and Developed Markets ex-US.
The following charts do not appear in the equity risk monitors but are available on request.
Volatility increased and factor correlations changed, but few changes were large
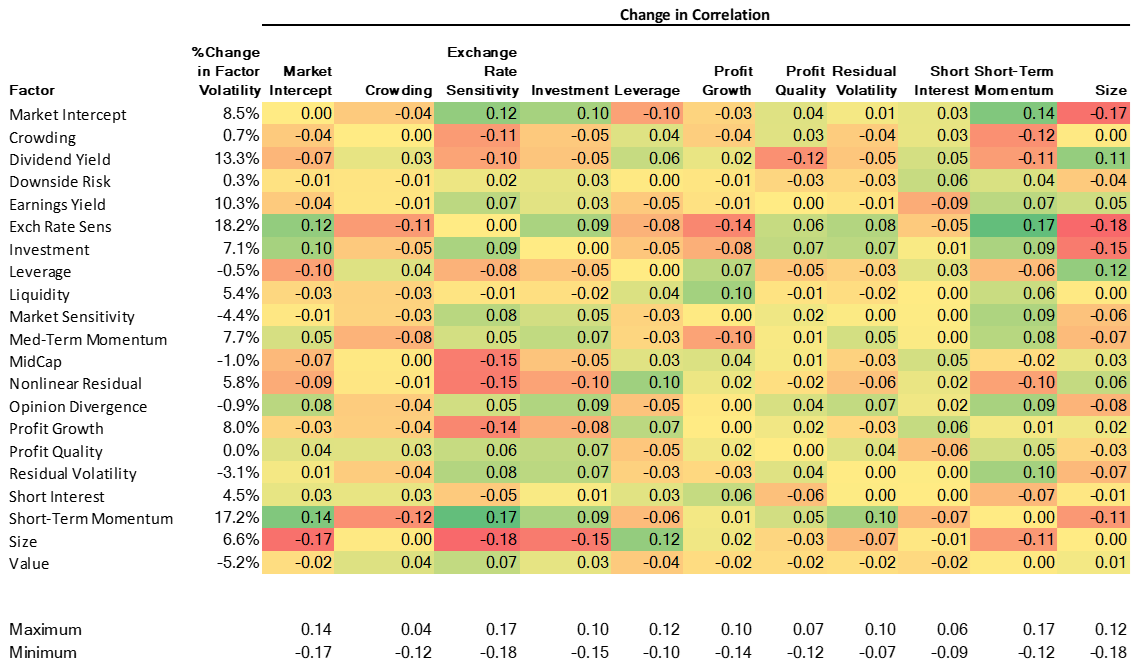
The outsized returns in the US did lead to some increases in factor volatility, although most volatility changes were relatively small. The following table shows proportional change in volatility in the first column, along with columns depicting selected changes in model correlations for the factors that saw the biggest differences. We have also included Crowding and Short Interest, to illustrate that, for example, Crowding became less correlated with Exchange Rate Sensitivity and Short-Term Momentum (i.e. those factors became less crowded), and Short Interest and Earnings Yield became less correlated as well. There were few increases in correlation between Crowding, Short Interest and the other factors, suggesting factors did not become more crowded or see higher levels of shorting.
We also note that the change in direction of the Size return resulted in lower correlations with the Market Intercept, Exchange Rate Sensitivity and Investment, while the latter two became more correlated with the Market Intercept. The biggest increase in correlation was between Short-Term Momentum and Exchange Rate Sensitivity, as they both saw the positive returns noted above.
This table also does not appear in the Risk Monitors, but current levels of volatility and correlation are shown in the equity monitors.
Changes in factor volatility and correlations, October to November 2024
You may also like


