

Beyond the fundamentals: Tariff and meme risk blind spots
Capturing systematic risk using statistical models
By Diana R. Baechle, Ph.D.
Understanding how your portfolio is exposed to major themes such as memes and tariffs is crucial for mitigating risk, particularly in high-volatile environments. Traditional fundamental risk models have long been the cornerstone of equity investing, offering a reliable and interpretable framework for understanding market dynamics. However, as new transient themes emerge, these models may fall short in capturing the full spectrum of risks investors face.
This study explores the integration of statistical risk models alongside fundamental models to enhance risk analysis in equity strategies, following the methodology presented in the paper “Statistical Models: More than just a second risk number” by Leon Serfaty.
By examining portfolios of memes and tariffs-related stocks, we uncover how statistical models can identify additional systematic risks that fundamental models might overlook. We focused on tariffs as a theme because we are currently witnessing a complete change in US trade policy, which undoubtedly affects the majority of equity portfolios. At the same time, social media amplifies reactions to AI, cryptocurrency, meme, and politically-influenced companies (collectively referred to here as memes), adding another layer of risk that needs consideration.
Through this approach, investors can gain a more comprehensive understanding of portfolio risks, enabling them to navigate the complexities of today's market with greater confidence and precision.
Meme stocks keep small gains, tariff-affected stocks plummet
For this study, we constructed two US equally weighted portfolios. The first, called “All_Meme Portfolio,” contains 22 stocks and includes “pure” meme stocks (e.g., GME, AMC), stocks affected by the current political environment (Tesla, Palantir, defense companies), cryptocurrency-related stocks (e.g., MicroStrategy, Coinbase), and AI-related stocks (e.g., Nvidia, Qualcomm). The second, called “Tariff Portfolio” contains 10 companies heavily affected by the newly introduced tariffs on US imports. The dates of the analysis are pre and post US tariff announcement on April 2: March 31 and April 7, 2025.
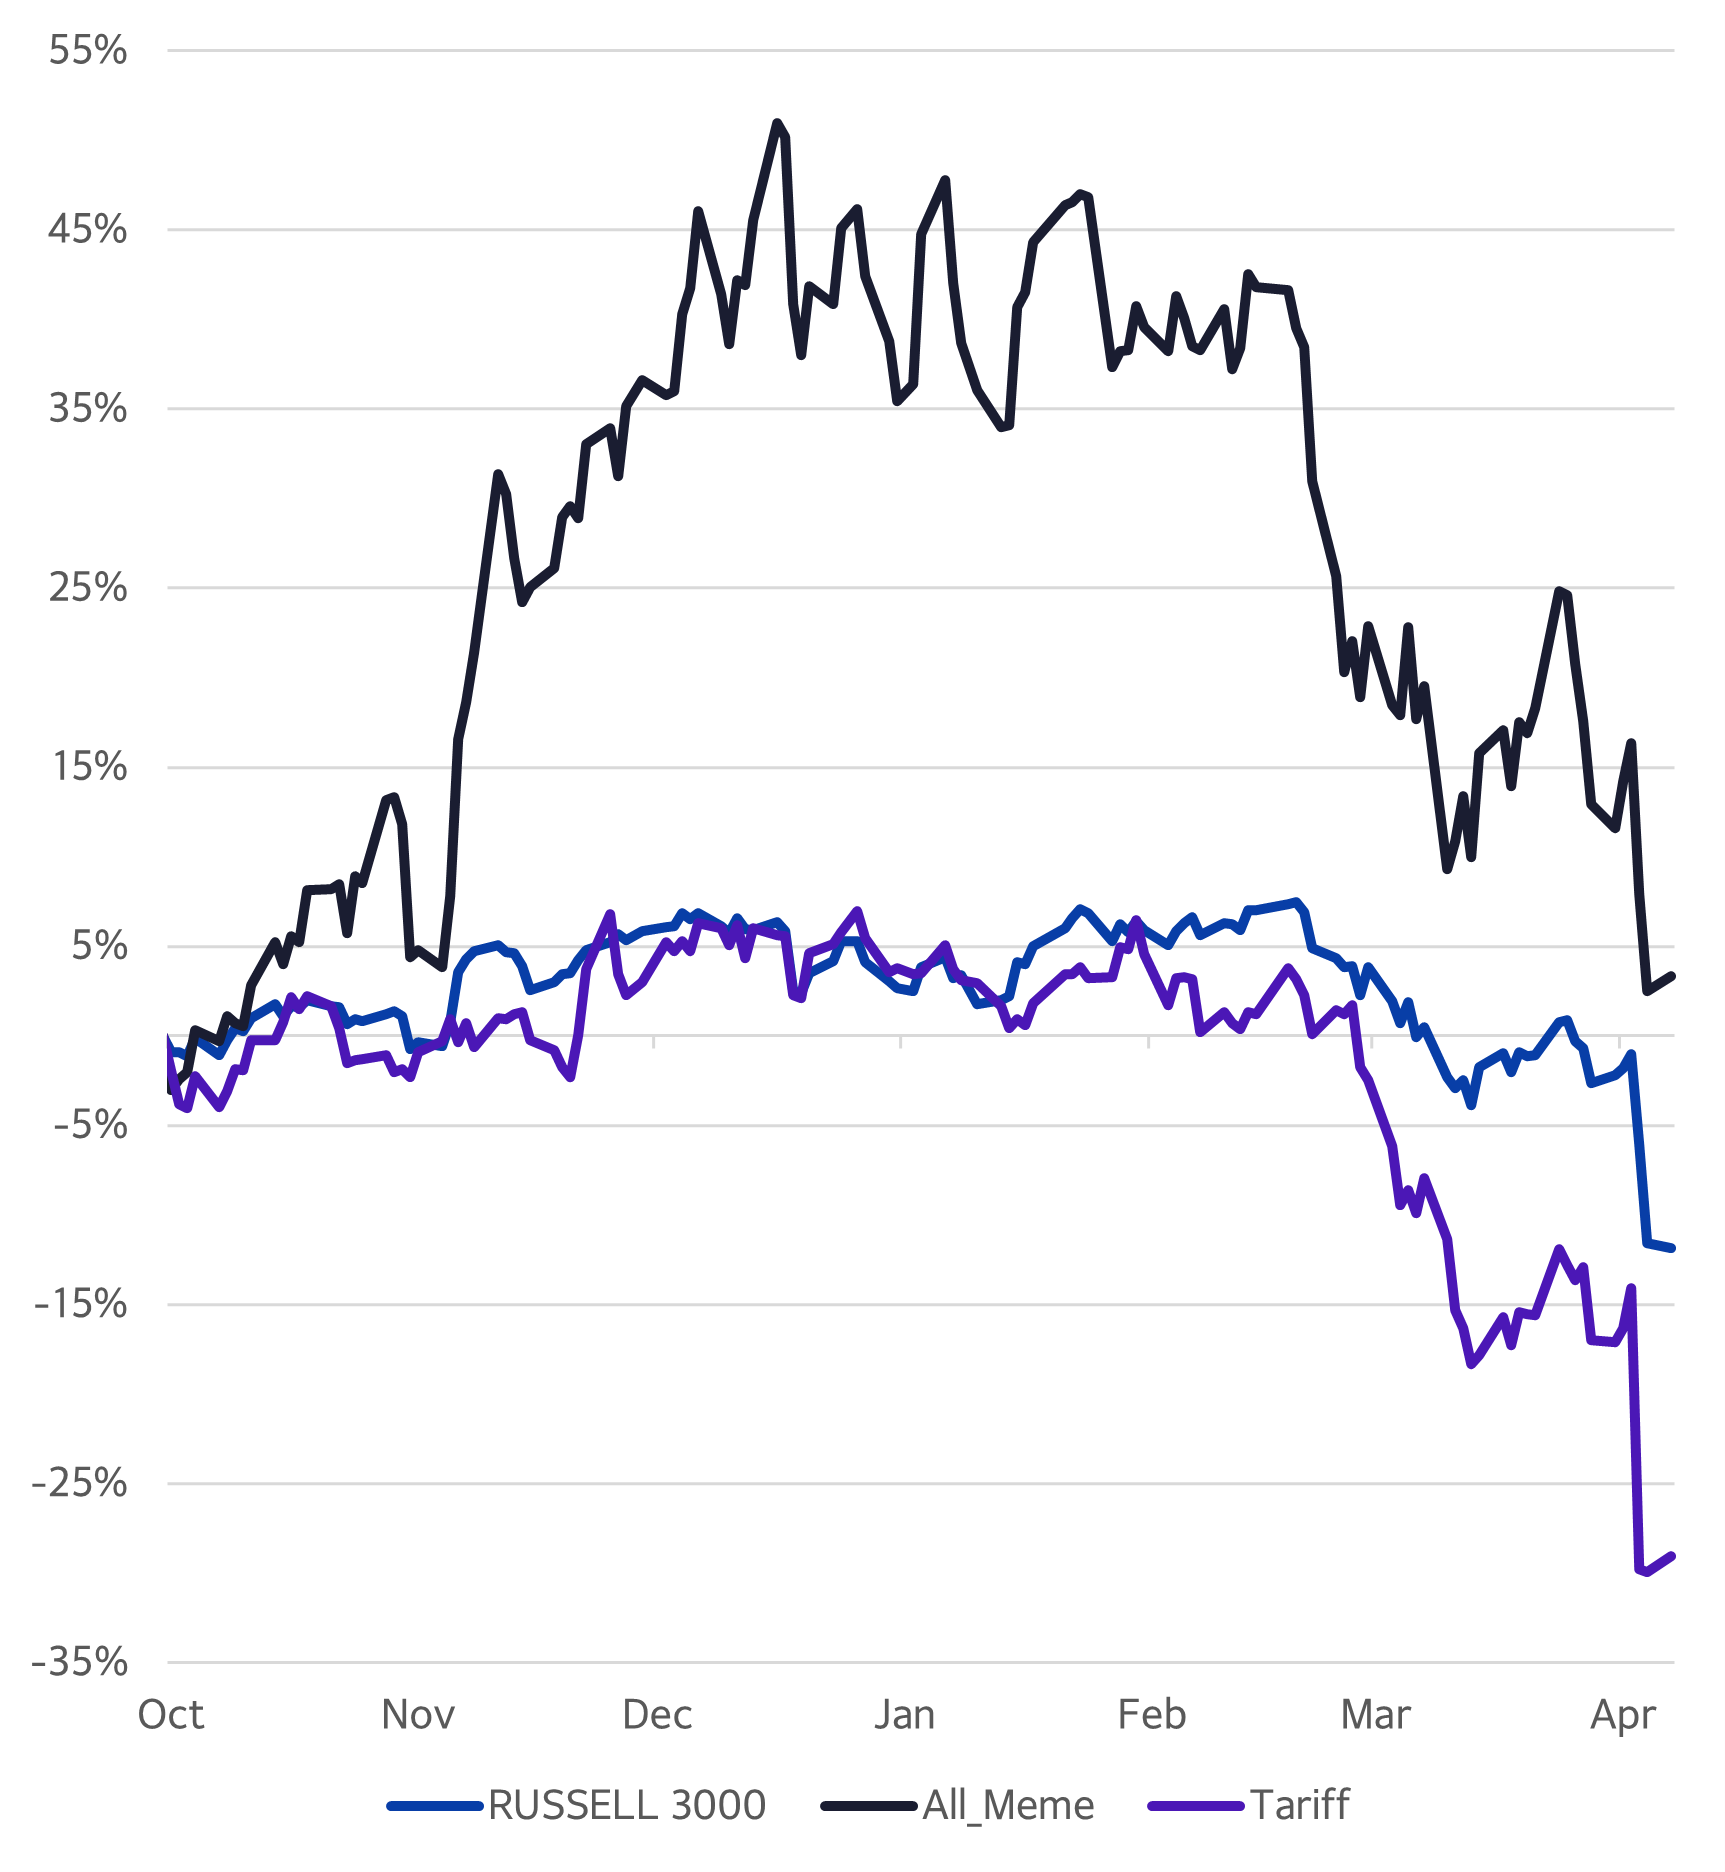
The All_Meme Portfolio has been highly volatile, mirroring the “Trump Bump” seen in the US market but in a much more exaggerated manner (Figure 1).
The Russell 3000 rose 7% between the end of September and the end of February, only to lose all of its gains in March as investor sentiment shifted from positive to negative after President Trump’s inauguration, and then tank in April following the US tariff announcement on April 2 (and subsequent retaliatory actions from key trade partners).
The All_Meme Portfolio experienced a dramatic surge from October to December, with its cumulative return reaching a 51% high, only to plunge in subsequent months. Although also being impacted by the tariff turmoil, it managed to maintain a positive return of 3% by April 7.
Interestingly, the Tariff Portfolio followed a similar trajectory to the Russell 3000 until the end of February, when it started to plummet as tariff policies became more concrete and were no longer perceived merely as negotiation tactics. After the tariff-related selloff, the Tariff Portfolio’s six-month return sunk near 30%.
Figure 1. Cumulative Returns from Sept. 30, 2024 to Apr. 7, 2025
Source: FTSE Russell, Axioma Portfolio Analytics
The additional risk found by statistical models
Fundamental risk models employ regression analysis and have an intuitive and consistent framework of fixed factors (such as market, style, and industry factors) that are easily interpretable. However, when clusters of related assets or the broader market are influenced by new and unforeseen factors not accounted for by the established set of fundamental factors, the fundamental risk model’s ability to explain market or portfolio behavior diminishes.
In contrast, statistical models adapt to evolving market conditions by identifying common patterns in returns among groups of assets on a daily basis. They employ a machine learning technique reliant on Principal Component Analysis, which does not assume designated factors and instead maximizes the explanatory power of the model. While the number of statistical factors is fixed, what each factor represents may change daily, reflecting whatever influences the market or portfolio at that moment. Statistical factors lack intuition and are difficult to interpret, yet often times clusters of assets with similar exposures reveal systematic risks invisible to highly structured fundamental models with pre-defined factors.
When looking solely at the forecasted risk for the Russell 3000, one would conclude that fundamental and statistical models have been mostly in agreement over the past six months. However, Tariff and All_Meme portfolios consistently showed higher statistical forecasts than their fundamental counterparts, the positive spread indicating additional risk in these portfolios that goes beyond the risks recognized by the fundamental model (Figure 2).
The comparison of the 20-day forward volatility of returns of the All_Meme and Tariff portfolios to the fundamental and statistical forecasts, shows that the statistical model was better capturing the portfolios’ risk than the fundamental counterpart, even if the statistical forecast doesn't reach the highs observed in the realized volatility levels of either portfolio.
The All_Meme portfolio has been more volatile than the Tariff Portfolio, despite having twice as many constituents, throughout the entire period except after April 2 when the Tariff’s portfolio’s realized risk doubled. Additionally, All_Meme showed a much wider spread, implying a larger source of risk captured by the statistical model for the All_Meme stocks.
Figure 2. Short-Horizon Statistical & Fundamental Risk Forecast vs 20-Day Forward Realized Volatility
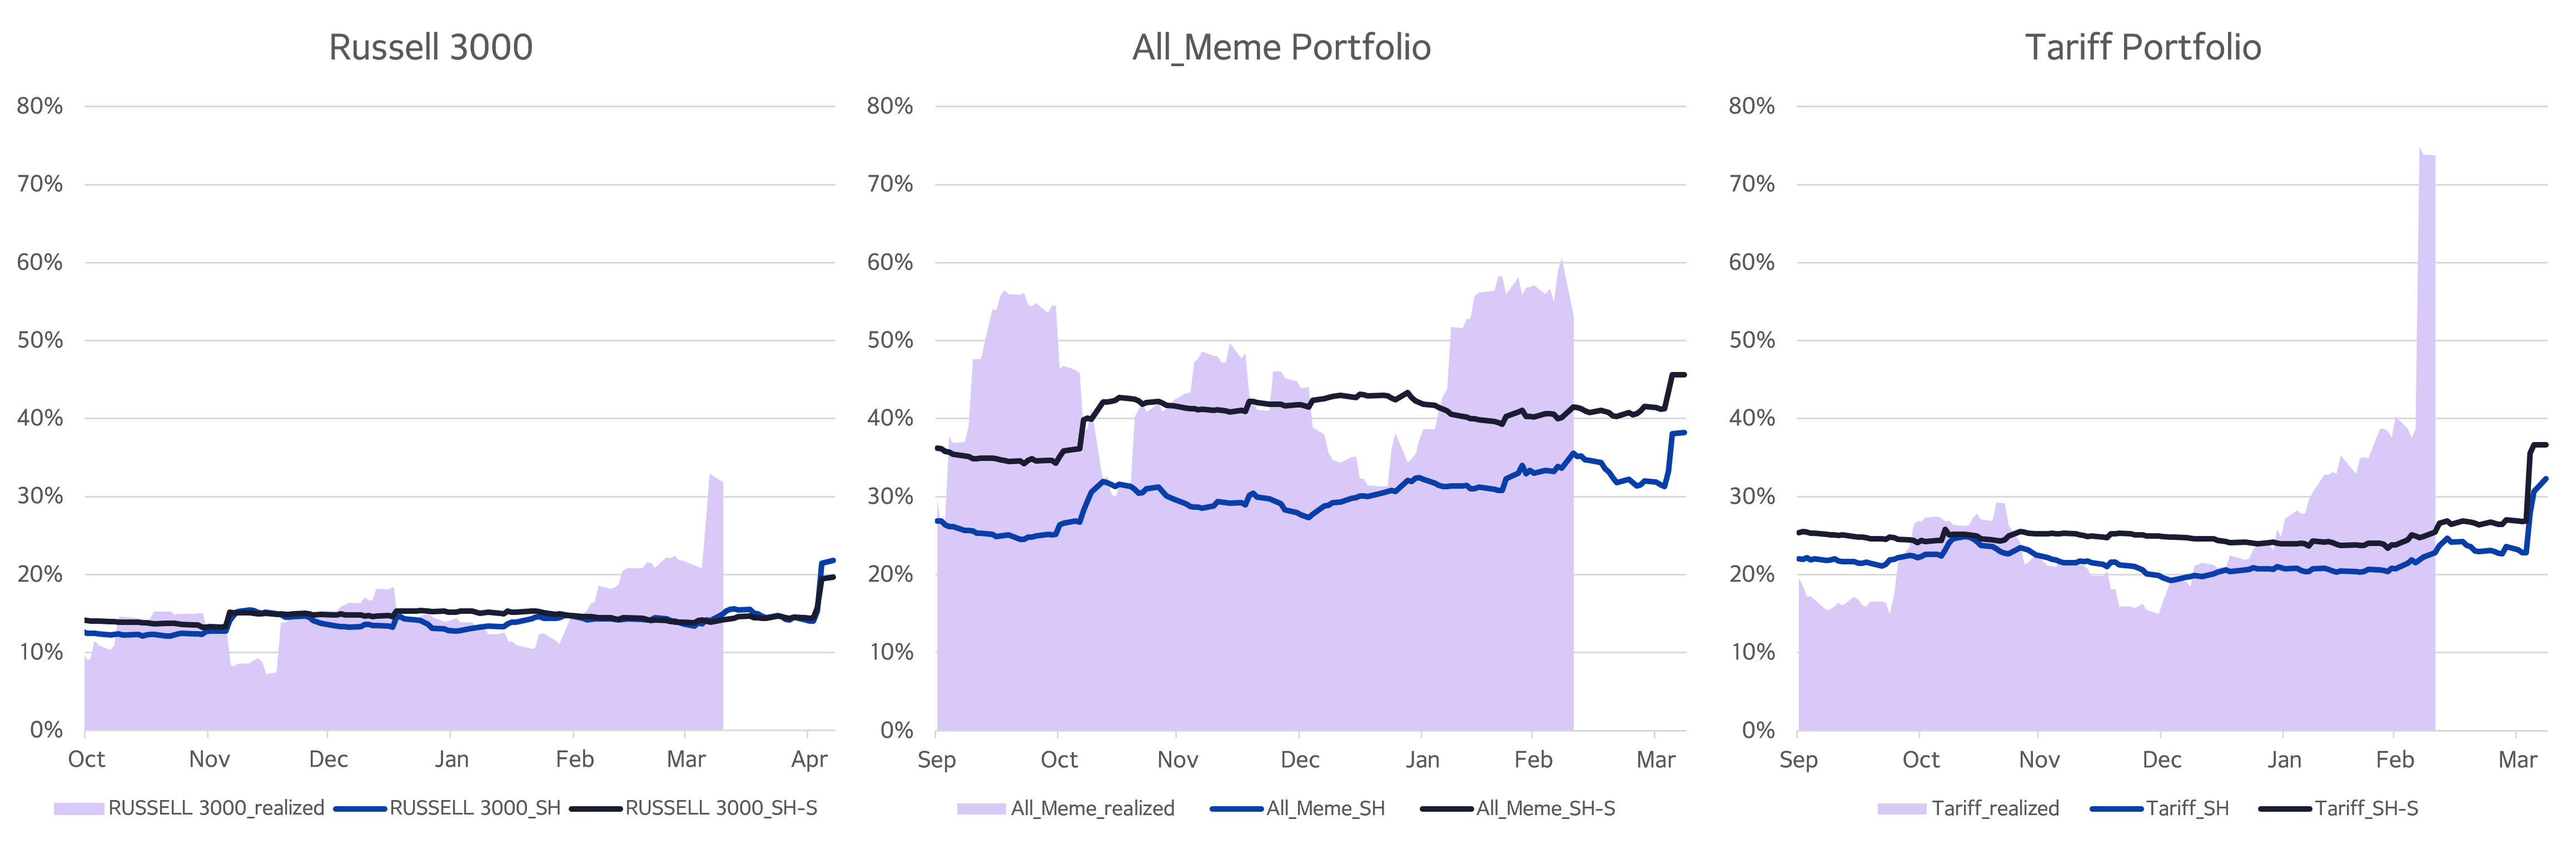
Source: FTSE Russell, Axioma US Fundamental Equity Factor Risk Model – Short Horizon (US5.1-SH) and Axioma US Statistical Equity Factor Risk Model – Short Horizon (US5.1-SH-S)
Statistical model captures more of the systematic risk
In a multi-factor risk model (fundamental or statistical), total risk is decomposed into factor risk and specific risk. Factor risk (also called systematic risk) is the risk explained by the factors in the risk model and is non-diversifiable, reflecting the commonalities among asset returns. Specific risk is quantified as residual variance unexplained by the model’s factors; it is diversifiable, idiosyncratic risk.
The statistical model shows a higher level and proportion of factor risk for both the Tariff and All_Meme Portfolios compared to the fundamental model, before and after the tariff announcement. This indicates that the statistical model captures additional systematic (non-diversifiable) risk in these portfolios that the fundamental model does not (Figure 3). This was even more pronounced on April 7, when systematic risk accounted for an even higher proportion of total risk compared to March 31.
Figure 3. Decomposition of Risk: Factor vs. Specific
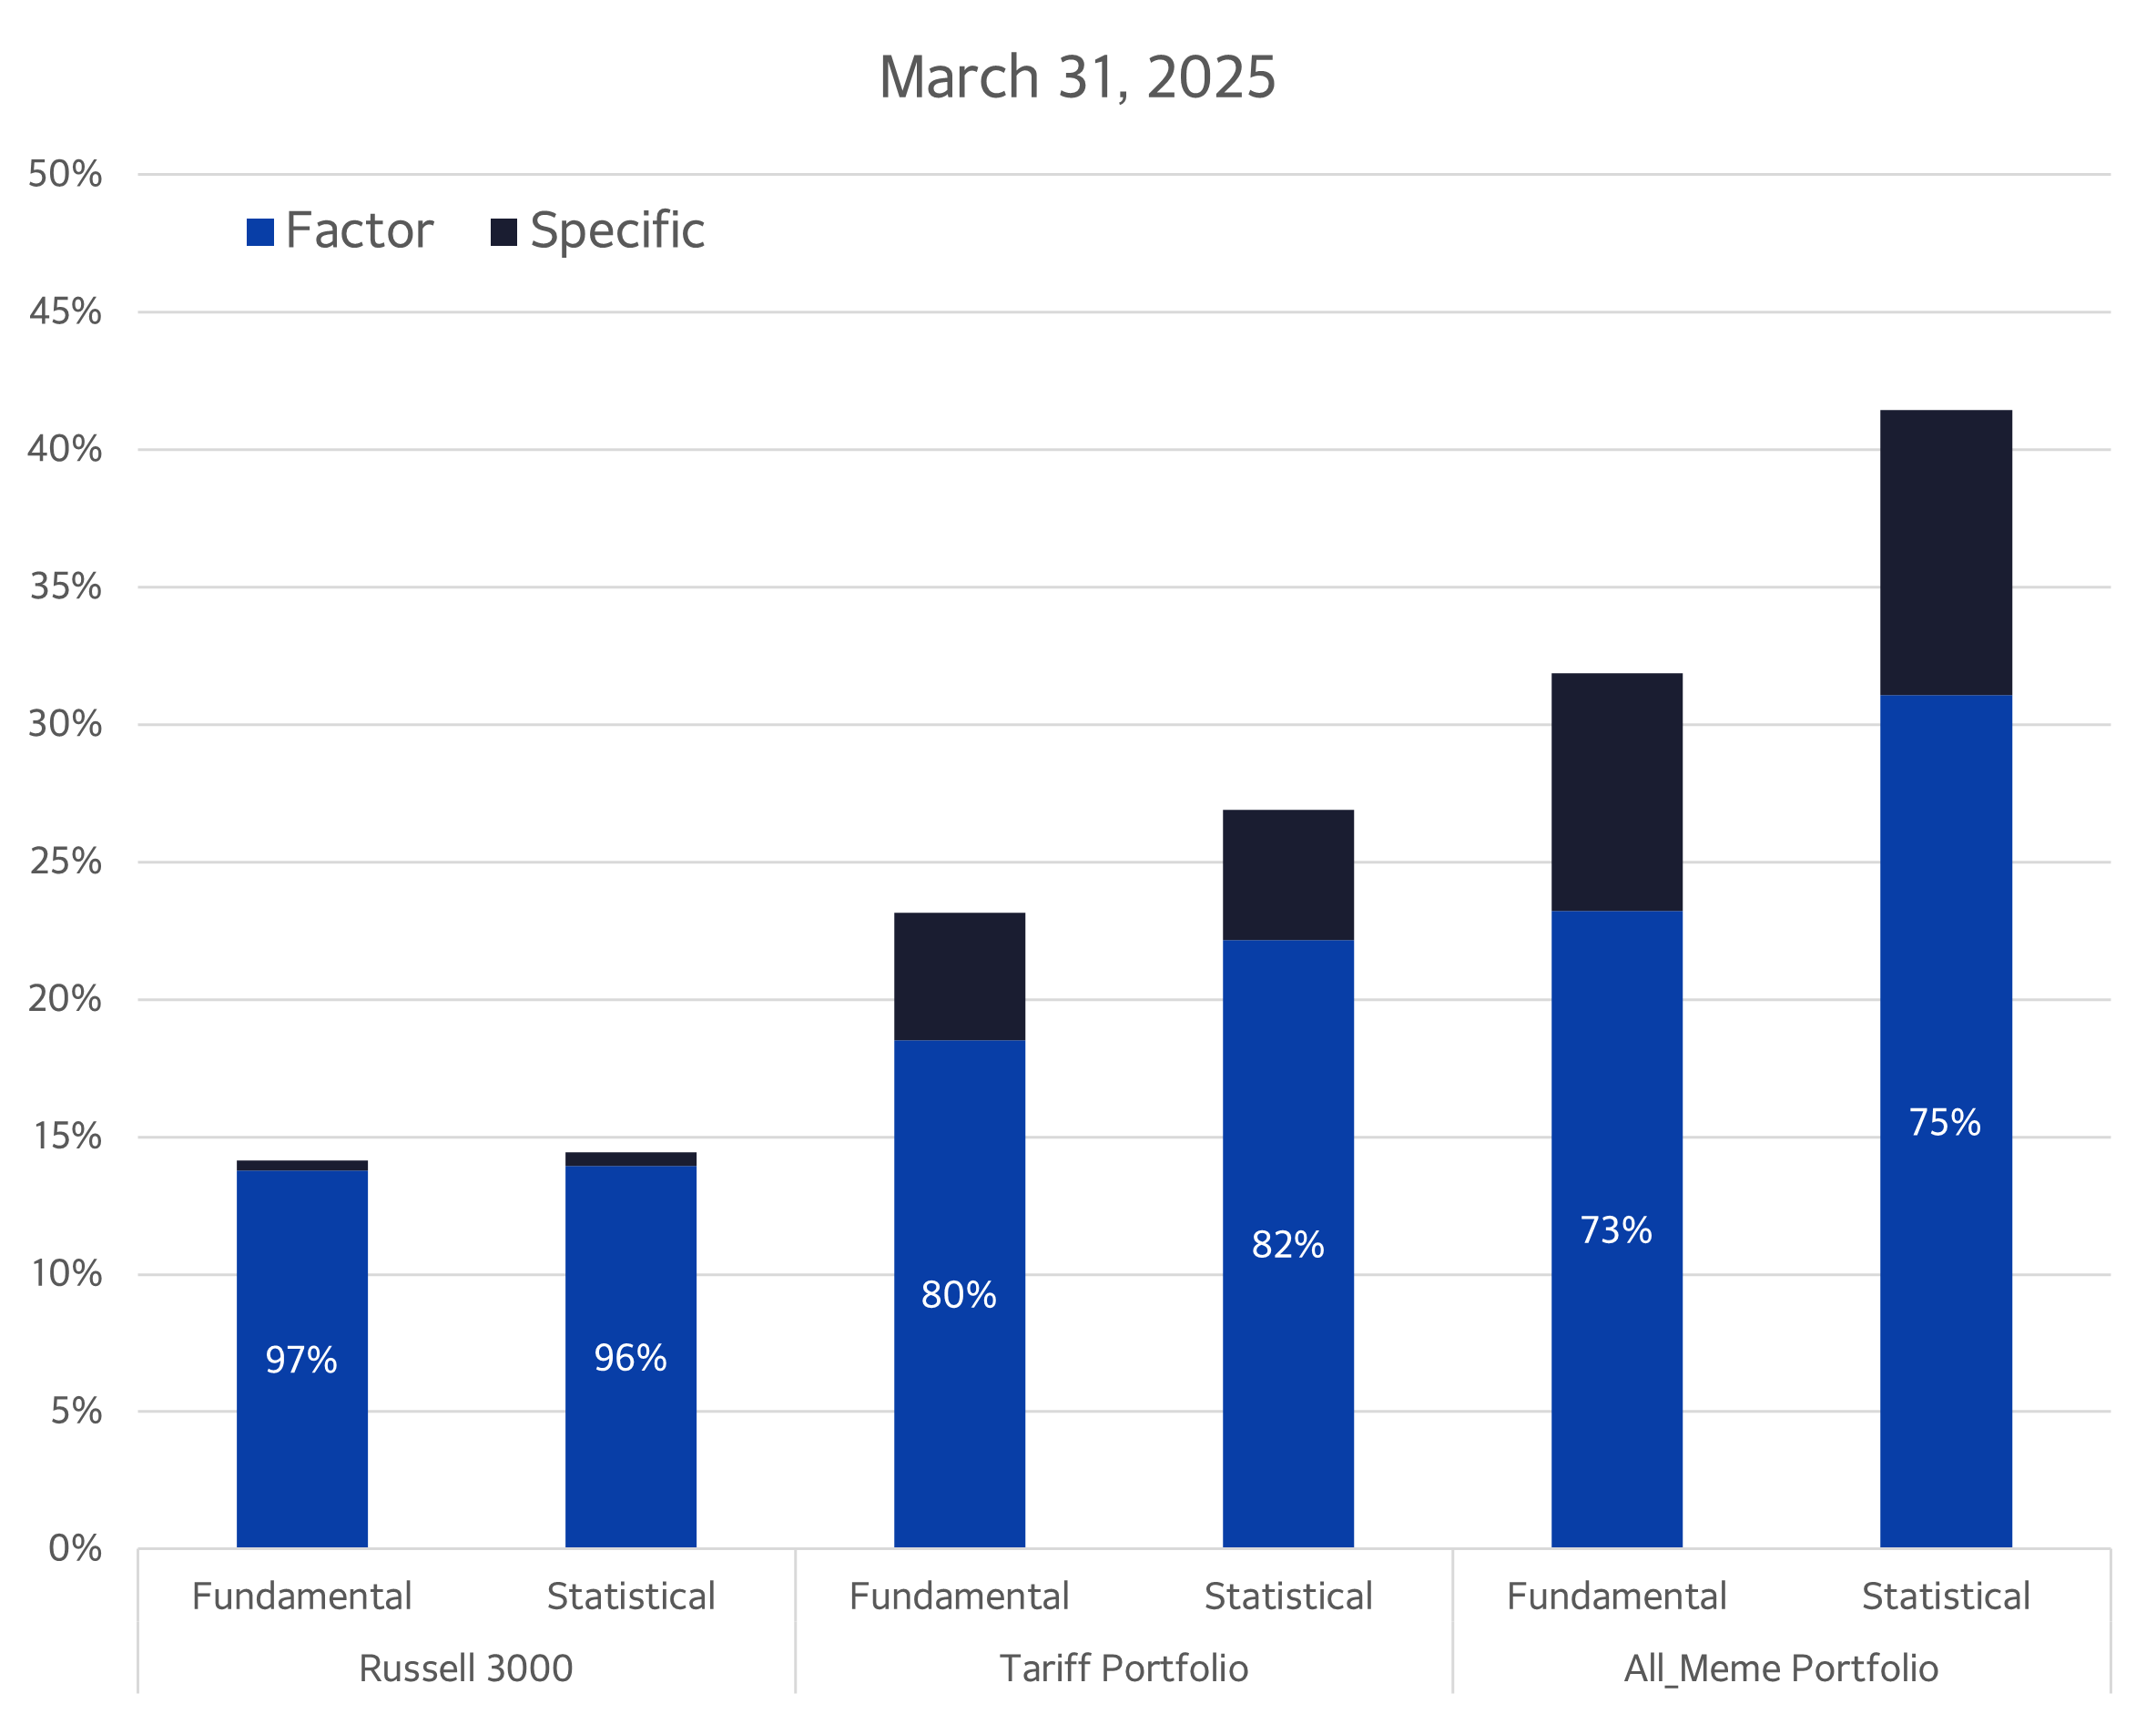
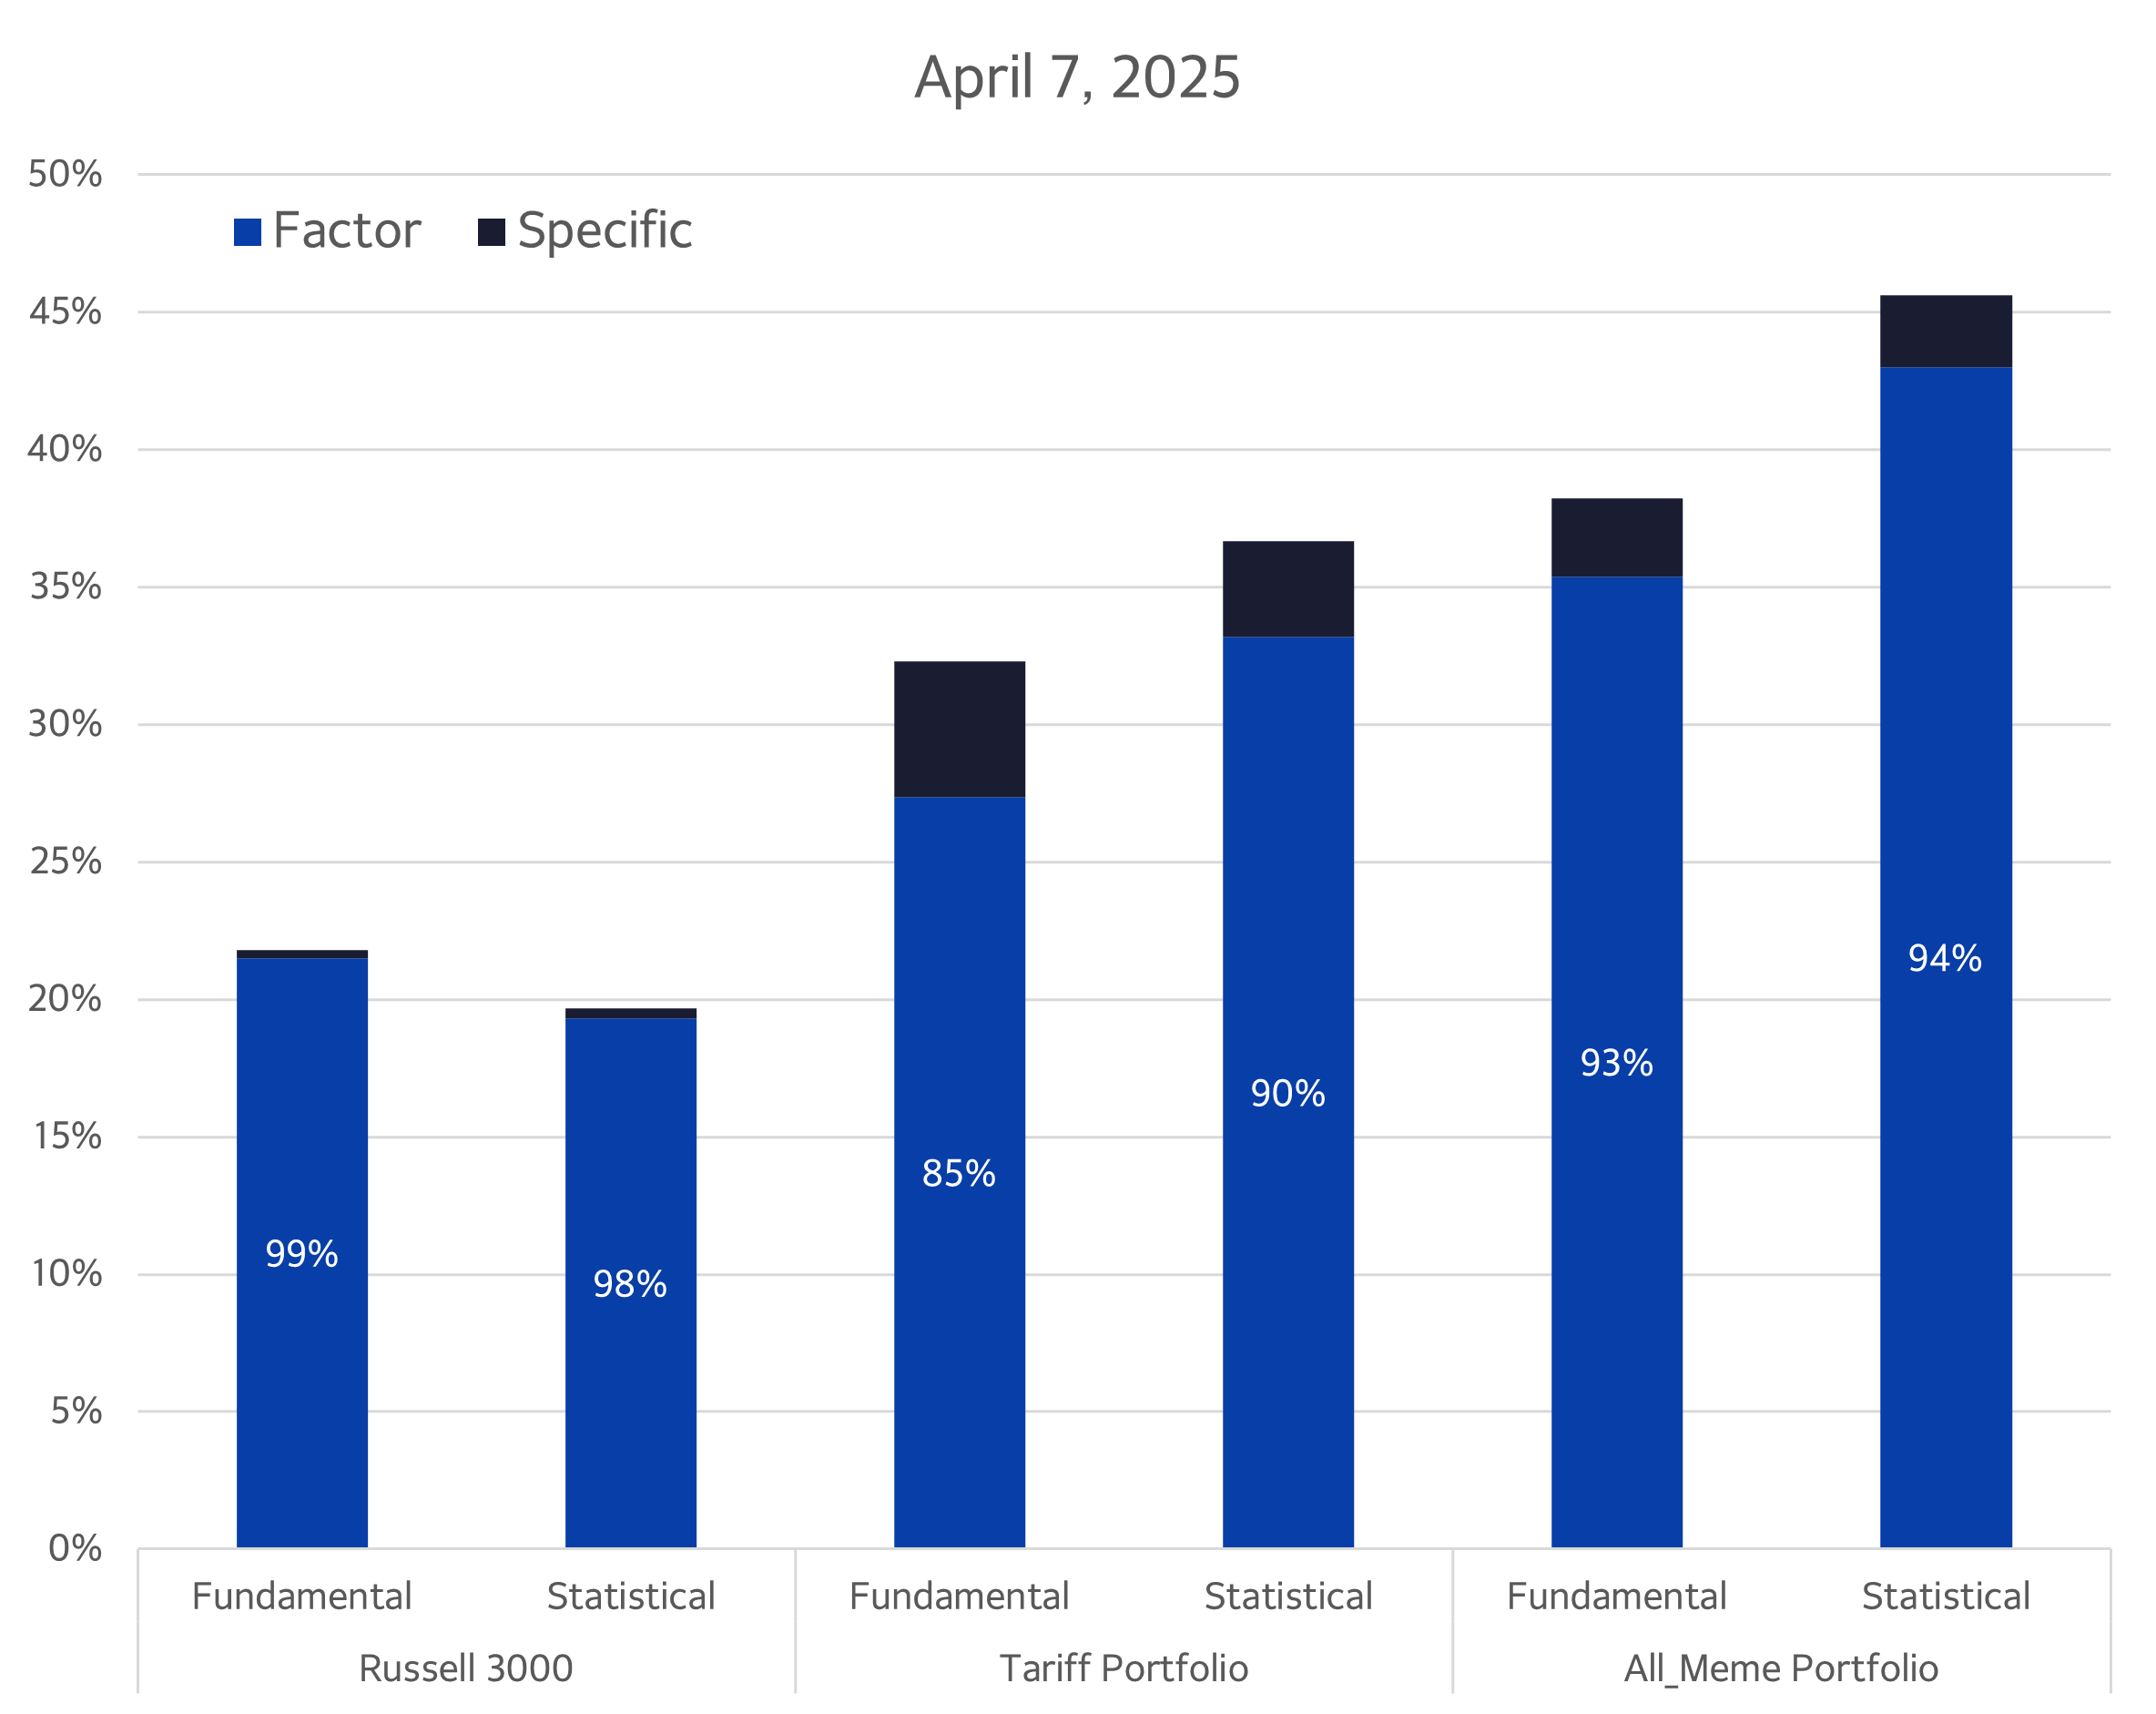
Source: FTSE Russell, Axioma US Fundamental Equity Factor Risk Model – Short Horizon (US5.1-SH) and Axioma US Statistical Equity Factor Risk Model – Short Horizon (US5.1-SH-S)
Asset similarities in hidden systematic risk
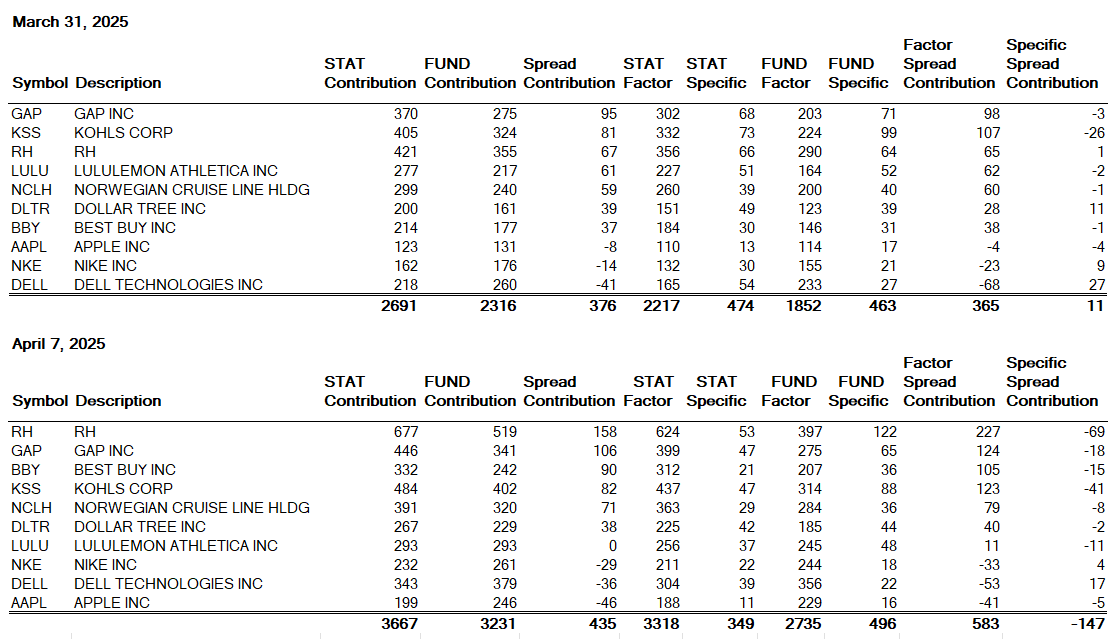
In the Tariff Portfolio, retail companies GAP, Kohl's, RH, and Best Buy contributed the most to the statistical-fundamental spread, collectively accounting for 75% of the spread on March 31 and over 100% on April 7 (Figure 4. A).
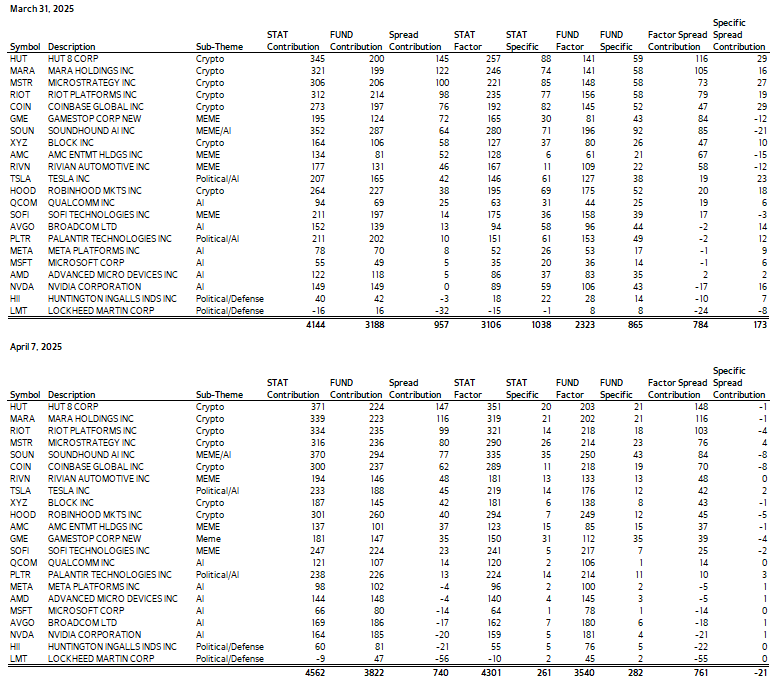
The majority of the newly discovered systematic risk in the All_Meme Portfolio is concentrated in crypto-related companies, which in aggregate accounted for 66% of the risk spread on March 31 and 79% on April 7. AI and defense companies contributed minimally or even negatively to the spread for the All_Meme Portfolio (Figure 4. B).
Figure 4. Risk Spread Decomposition at Asset Level
A. Tariff Portfolio
B. All_Meme Portfolio
Source: Axioma US Fundamental Equity Factor Risk Model – Short Horizon (US5.1-SH) and Axioma US Statistical Equity Factor Risk Model – Short Horizon (US5.1-SH-S)
Statistical factors capturing themes
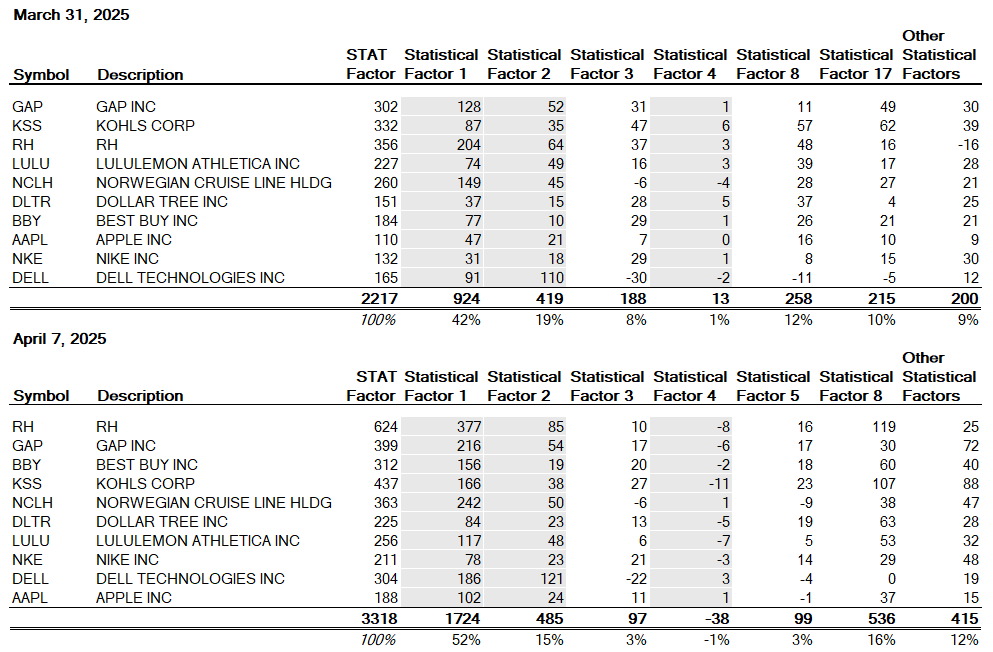
Further analysis reveals which factors contributed the most to statistical factor risk. Statistical Factors 1, 2, and 4, which collectively accounted for over 60% of the total statistical factor contribution for Tariff Portfolio on both March 31 and April 7, most likely represent the market contribution to risk as they are responsible for the majority (90%) of the factor risk for the Russell 3000—not shown here for brevity purposes.
On March 31, Factors 3, 8, and 17 together accounted for 30% of the statistical factor risk, while on April 7, Factors 3, 5, and 8 captured the largest portion (20%) of extra-market factor risk. Factor 8 appears to have captured the primary theme of the Tariff Portfolio on both dates (Figure 5. A).
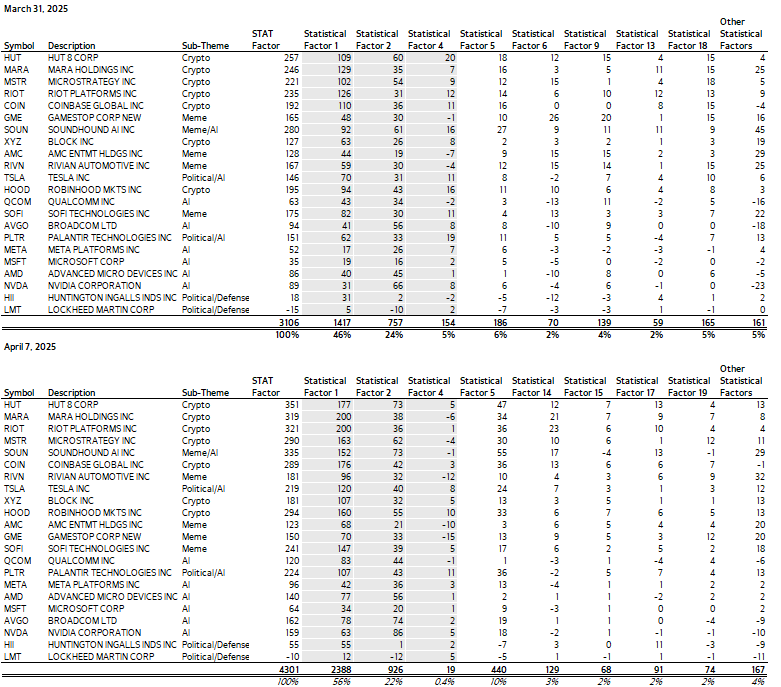
For the All_Meme Portfolio, Factors 1, 2, and 4 accounted for over 75% of the systematic risk both on March 31 and April 7. On March 31, the themes in the All_Meme Portfolio were captured by Factors 5, 6, 9, 13, and 18, which together accounted for 20% of the statistical factor risk. Interestingly, these factors were distinct from those capturing the themes in the Tariff Portfolio on that date.
On April 7, Factors 5, 14, 15, 17, and 19 contributed the most to All_Meme’s statistical systematic risk, collectively accounting for 20%. Factor 5 was the largest contributor to Tariff Portfolio’s statistical factor risk on both dates (Figure 5. B).
If certain statistical factors are found to capture identified themes, one could limit exposure to these factors if they prefer their portfolios not to be influenced by these themes.
Figure 5. Individual Factor Contributions to Statistical Factor Risk
A. Tariff Portfolio
B. All_Meme Portfolio
Source: Axioma US Fundamental Equity Factor Risk Model – Short Horizon (US5.1-SH) and Axioma US Statistical Equity Factor Risk Model – Short Horizon (US5.1-SH-S)
Conclusions
Never has it been more important to understand exposures to emerging themes like the ones we examined here. While fundamental models provide a reliable and interpretable base-level risk assessment, statistical models offer a dynamic and adaptive approach that captures transient and undefined themes.
This study demonstrates that statistical models can identify additional systematic risks in portfolios that fundamental models may overlook, particularly in portfolios heavily influenced by current political and social factors.
By leveraging both fundamental and statistical models, investors can achieve a more comprehensive understanding of portfolio risks and enhance their risk management strategies.
"The statistical model captures additional systematic (non-diversifiable) risk in these portfolios that the fundamental model does not."