

Risk-based or Brinson attribution?
Author
Melissa R. Brown, CFA
Head of Investment Decision Research
Details matter when it comes to measuring performance attributions
Before diving into the specifics of performance attribution, let’s start with the basics of risk models. An investor must take on risk to generate return. Risk models are constructed to enable investors to identify sources of portfolio risk, and ensure they are commensurate with return expectations across country, currency, industry, and defined factors (fundamental, statistical, macroeconomic). Risk models can be used in many ways, from portfolio construction to stress testing to risk and return attribution. When used for attribution, they allow an investor to understand what drove the portfolio risk, and therefore its return.
Expanding on the performance attribution use case, risk-based (or factor-based) performance attribution offers an alternative to traditional returns-based methods, such as Brinson attribution. The granular and multivariate nature of risk-based performance attribution enables investors to uncover unintended exposures and differentiate between performance from desired systematic bets, unintended bets and stock specific contributions.
Additionally, this method provides detailed risk analysis that returns based attributions lack.
Brinson attribution vs. Risk-based performance attribution
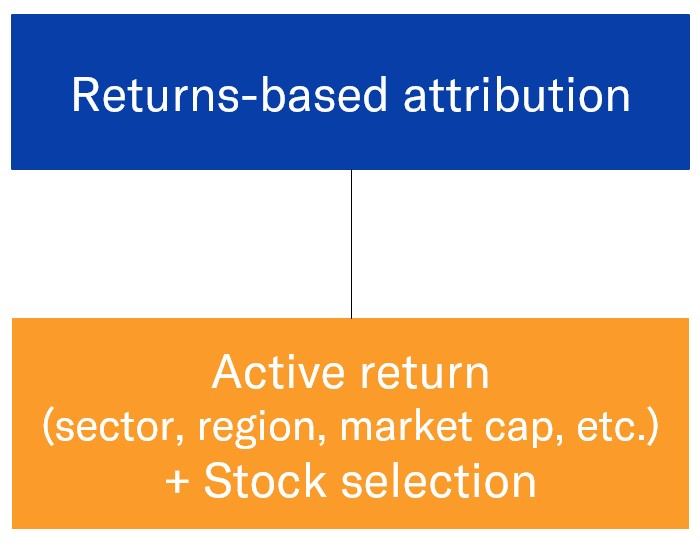
Traditionally, Brinson and other returns-based performance attributions have been used to evaluate portfolio and manager performance. Brinson attribution is based on active weights relative to a benchmark with returns generally split between allocation and security selection effects. The method identifies whether a manager's performance is driven by allocation decisions and how the manager's selection fares within the allocation. While Brinson attribution can provide a broad assessment of manager decision making based on over/under-weights versus an underlying benchmark, that picture can vary substantially depending on which reporting group is used (sector, region, market cap, etc.) for the allocation effect. Moreover, the technique lacks risk insight and does not provide analysis into underlying return drivers or intended vs. unintended exposures.
Figure 1: Brinson attribution illustration
In contrast, risk-based performance attribution uses factor risk models to provide a granular view of risk exposures and how they drive returns.
Figure 2: Factor-based performance attribution illustration
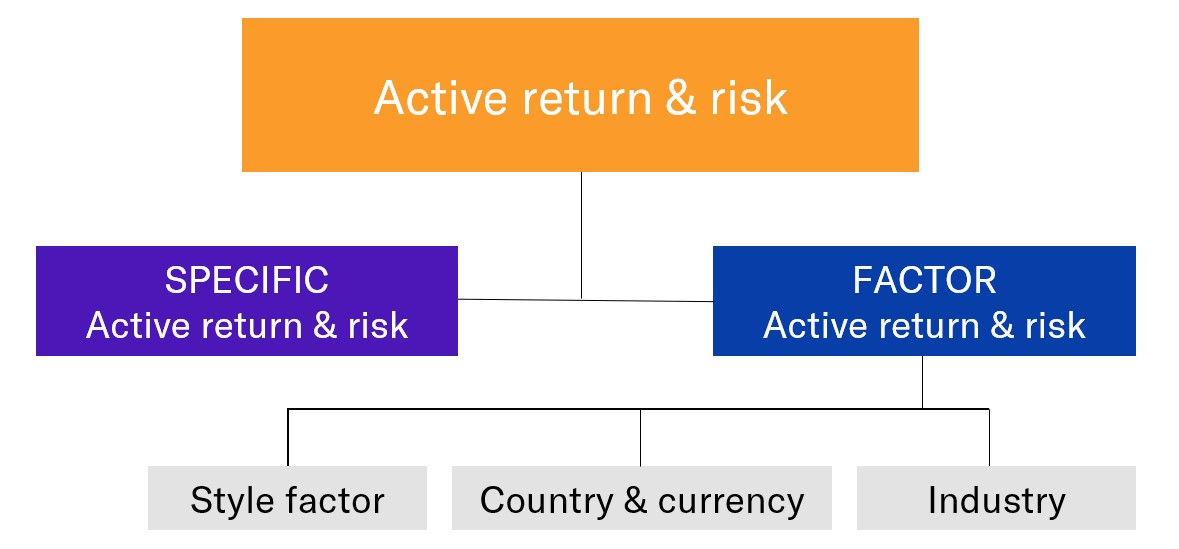
Active risk and active return are decomposed into factor active risk and return and specific active risk and return. Factor active risk and return can be further broken down into style factors, industry exposures, and currency/country impacts – whatever risk factors are included in the risk model used for the attribution. The specific active effect, sometimes known as the residual, is the remaining performance that cannot be explained via systematic exposures. This attribution methodology therefore provides a comprehensive picture of risk/return drivers and exposures within a portfolio.
Case study: High dividend ETF performance attribution
Let’s look at a comparison between Brinson and risk-based analysis using a real-world example. We generated attributions for a popular dividend focused ETF for the calendar year 2021. Risk-based performance attribution was calculated using the Axioma US Equity Factor Risk Model (US4).
Table 1: Brinson attribution effects
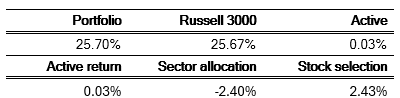
Source: Axioma Portfolio Analytics, Russell 3000
In Table 1, both methods arrive at the same number for active return (0.03%) but provide different explanations. For this comparison, we leveraged sector allocation as the reporting group since it is the most common. In this case, the analysis splits the return between Sector Allocation (-2.40%) and Stock Selection within each sector (2.43%). A potential conclusion could be that the ETF’s dividend methodology resulted in sector bets that negatively impacted performance. In contrast, stock selection within sector had a large positive contribution which offset the poor sector allocation. There are no insights into risk or any additional exposures that drove investment decisions and the strategy’s return.
While risk-based performance attribution calculates the same active return, it provides a more thorough view of return and risk. It breaks down the active risk and corresponding return from various factors (see Table 2) and further details style factor exposures, contribution to return, and contribution to risk (see Table 3).1
This shows us that factor returns contributed a positive 3.26% to return. Relative to Brinson attribution, we can see that both analyses agree industry bets detracted, however Brinson showed performance was due to “stock selection” only. With risk-based performance attribution, we know that style factor exposures contributed overwhelmingly to return (6.00%), whereas stock specific exposures actually detracted (-3.24%) and offset the positive style factor contribution. Additionally, we can get a drill-down view of exposures and contribution to risk and return of underlying style factor, which helps paint a complete picture.
Table 2: Risk-based performance attribution
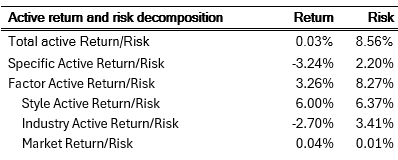
Source: Axioma US Equity Factor Risk Model (US4), Axioma Portfolio Analytics
Table 3: Contribution to active risk and returns
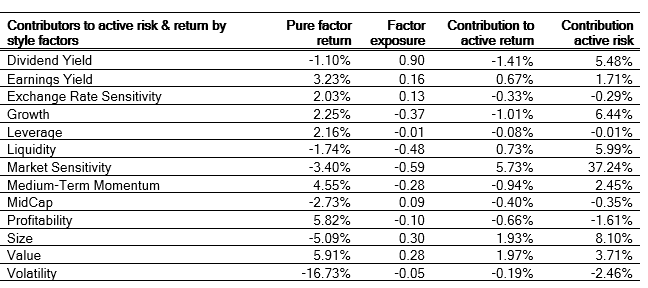
Source: Axioma US Equity Factor Risk Model (US4), Axioma Portfolio Analytics
Given this is a dividend focused ETF, the underlying methodology is designed to capture dividend paying stocks within the security selection and weighting. As expected, we do see a sizable exposure to the Dividend Yield factor (0.90). But given that it was not a good year for that factor (-1.10%), the exposure to Dividend Yield hurt performance, contributing -1.41%. The largest positive contribution to return (5.73%) came from market sensitivity, aka beta. In a year like 2021, when low Market Sensitivity stocks fared far better than their high-beta counterparts (the factor return was-3.40%), the strategy’s low beta nature (-0.59 exposure) was the main positive driver of performance.
On the risk side, Market Sensitivity accounted for more than one third of active risk (37.24%). It’s important to note that such a sizable contribution to active risk from Market Sensitivity can mean swings in active performance just due to what kind of beta regime the market is in. Despite the fund name, Dividend Yield does not make the top 5 contributors to risk, but Size does.
Brinson attribution for overview statistics
What does this example show us? The basic measurements from Brinson attribution provide high-level insight into the sources of active return, but do not provide enough granular details on return and risk drivers, especially in portfolios that make factor bets. At times this view can be deceptive as returns due to systematic factor exposures can be misinterpreted as stock selection (or alpha).
With risk-based performance attribution, investors have a more comprehensive view of return and risk. For the ETF, the analysis indicates that positive contribution to return generated was largely due to the low beta characteristics, among other factors. The Dividend factor, which the methodology actively tilts towards, negatively impacted 2021 performance. This granular level of insight is important for investors like you to consider as when reporting on portfolio performance and due diligence.
Our offering of equity factor risk models
The tables above were generated from using our equity risk models and Axioma Portfolio Analytics which provides risk, performance analysis and attribution in one integrated view.
Our suite of Axioma Equity Factor Risk Models provide distinct and comprehensive insights across geographies and multiple time horizons. The breadth and depth are reflected in the extensive factor library and unique exposure analysis for multiple views of risk across your defined factors.
Fundamental Model (Short and Medium Term): Comprehensive style factor (e.g., Momentum, Liquidity, Size, and Value) coverage for risk and performance attribution.
Macroeconomic Projection Model: Exposure analysis to macro factors, including inflation, interest rates, credit, and commodities.
Statistical (Short and Medium Term): Important risk and portfolio construction insights. While not investable, statistical factors provide insights into near-term changes in market volatility.
US Trading Model: Provides accurate portfolio risk exposures and forecasts for risk horizons up to a month, better capturing the short-term impact of rapidly changing market conditions
"The basic measurements from Brinson attribution provide high-level insight into the sources of active return, but do not provide enough granular details on return and risk drivers, especially in portfolios that make factor bets."
References/Footnotes
This article was originally published in May 13, 2022 by Kevin Dunbar, CFA and Melissa R. Brown, CFA on qontigo.com and was updated in August 2024.
1 Note that attribution individual industry allocations can also be provided by Axioma Portfolio Analytics, but here we focus on the aggregate impact.