

Breaking down performance attribution
Author
Melissa R. Brown, CFA
Head of Investment Decision Research
Is your Value ETF really Value? If you’re only using Brinson performance attribution, you may never know.
In a previous post, we looked at the differences between Brinson performance attribution and factor-based performance attribution. To recap, Brinson attribution and other returns-based performance attributions do not provide insights into risk or analyze the underlying return drivers and the differences between intended and unintended exposures. The Brinson method assesses active weights compared to a benchmark, dividing returns into allocation and security selection effects and it determines whether a manager's performance is influenced more by allocation choices or by the success of selections within those allocations.
For those investors looking for a general, high-level view, Brinson performance attribution may be sufficient. However, it’s important to remember that allocation versus selection results from manager decisions based on deviations from a benchmark can vary significantly depending on the chosen reporting category (such as sector, region, or market cap) for the allocation effect.
Risk-based performance attribution for deeper insights
Risk-based performance attribution offers an alternative, more detailed analysis of risk exposures and their impact on returns. Using factor risk models, managers and investors are able to glean more information about active risk and active risk decomposition, factor active risk and return, and specific active risk and return.
The advantage is clear: this factor-based performance attribution gives you a much more comprehensive picture of what is driving risk and return drivers in a portfolio.
A value ETF: Using Brinson performance attribution
Don’t just take our word for it – let’s instead look at a comparison of the two methods using a popular US Value-oriented ETF. Using the latest version of the Axioma US Equity Factor Risk Model (US5.1), the S&P 500 as the ETF benchmark and our equity performance attribution software, Axioma Portfolio Analytics, we generated the attributions below.
Table 1: Value ETF Brinson performance attribution
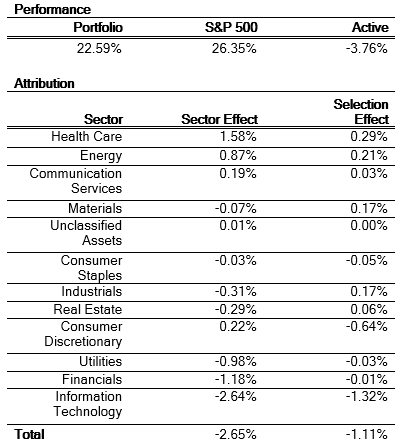
Source: Axioma Portfolio Analytics, S&P 500 Index
Of course both methods arrive at the same number for active return (-3.76%) but provide different explanations (Tables 1 and 2). Given the high degree of underperformance, the portfolio manager and/or an investor may want to dig a little deeper to understand what happened. For this comparison, we leveraged sector allocation as the reporting group since it is the most common source of classification. In this case, the analysis splits the return between Sector Allocation (-2.65%) and Stock Selection within each sector (-1.11%).
A potential conclusion could be that the ETF's methodology resulted in sector bets that negatively impacted performance (only allocation to Health Care and Energy helped) and that the cheaper stocks within each sector also fared poorly (mainly from stocks selected within Consumer Discretionary and Information Technology). With this methodology, there are no insights into risk or any additional exposures that drove investment decisions and the strategy's return. In addition, if the methodology was something other than choosing sectors and then stocks within each sector, this attribution does not provide any guidance about changes the manager could potentially make.
Factor performance attribution for comprehensive risk-return analysis
Risk-based performance attribution provides a more thorough view of return and risk. It breaks down the active risk and corresponding return from various factor blocks (as in Table 2) and further details about style factor exposures, contribution to return, and contribution to risk (see Table 3), while also accounting for the impact of industry exposures.
Table 2: Value ETF risk-based performance attribution
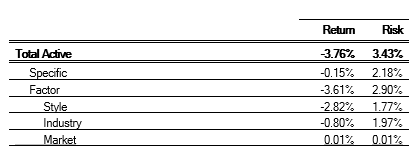
Source: Axioma Portfolio Analytics, Axioma US Equity Factor Risk Model (US5.1), S&P 500 Index
The factor attribution shows us that almost all the underperformance came from factors (which also includes sectors, of course). Relative to Brinson attribution, we can see that both analyses agree industry bets detracted, but factor attribution attributed a much lower proportion of the underperformance to industries, -0.80%. With risk-based performance attribution, we can see that style factor exposures contributed substantially to the underperformance (-2.82%), whereas stock specific exposures had a small impact (-0.15%). Additionally, we can get a drill-down view of exposures and their contribution to risk and return of underlying style factor, which helps paint a complete picture.
Given that this is a Value focused ETF, the underlying methodology is designed to capture cheaper stocks (i.e. low price/book ratio, denoted as Value in the Axioma risk model). Sector weights are a by-product of the stock selection methodology, rather than deliberately chosen. As expected, we do see a sizable risk exposure to the Value factor (0.19 standard deviations above the S&P 500, and 4.8% of the total active risk). The Value factor actually fared well in 2023, and the exposure to it led to a positive return contribution of 1.11%.
However, the methodology led to some potentially unwanted exposures, such as a negative exposure to Profit Quality, that dragged return down with a -2.08% contribution. Similarly, the focus on Value led to a small-cap bias in the portfolio, which detracted another 160 basis points.
On the risk side, Medium-Term Momentum accounted for about 16% of active risk. Although the exposure was small, the factor was quite volatile, and thus a big risk contributor. At almost 10% contribution to risk, Market Sensitivity was the second-highest contributor to risk.
Despite the fund name, Value is just the fourth-largest contributor to risk whereas Size is in third place. Also note that some factors are diversifying – that is their risk contribution is negative, but since there is an exposure to the factor, it still may contribute to return. Crowding, with a contribution to return of +0.23% is such a factor.
Table 3: Contributions to active risk & returns for Value ETF1
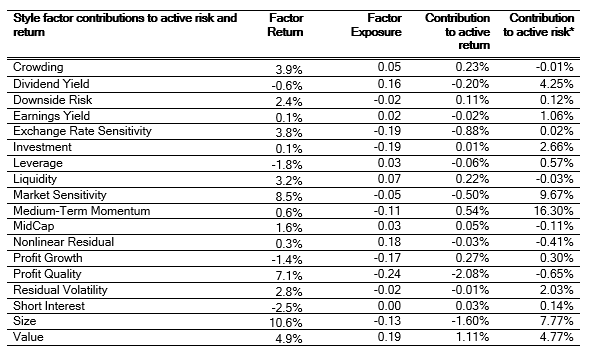
*As of year end
Source: Axioma Portfolio Analytics, Axioma US Equity Factor Risk Model (US5.1), S&P 500 Index
Look under the hood
As you can see from the example above with the Value ETF, it pays to apply a more granular risk-based performance attribution approach to understand what the real sources of risk and return are – especially in portfolios that make factor bets. At times, this view can be deceptive as returns due to systematic factor exposures can be misinterpreted as stock selection (or alpha).
For this Value ETF, the analysis indicates that much of the risk – and subsequent drag on performance – was probably in unintended (although possibly unavoidable) bets. Value, the main theme, actually did what it was supposed to. This granular level of insight is important for managers to consider as when reporting on portfolio performance and for investors trying to understand if the manager is doing what she says she will.
We offer a number of solutions for performance attribution on SimCorp One, including Axioma Portfolio Analytics. Contact us to learn more.
Reference
1 Note that attribution individual industry allocations can also be provided by Axioma Portfolio Analytics, but here we focus on the aggregate impact.