AXIOMA ROOF™ SCORE HIGHLIGHTS
WEEK OF JULY 1, 2024
Potential triggers for sentiment-driven market moves this week
- US: FOMC minutes and Fed Chair Powell’s speech, manufacturing and services PMI data for June, and the jobs report.
- Europe: Snap parliamentary elections in France and the UK. Factory orders and industrial production data for Germany, and Inflation rates for the Eurozone.
- APAC: Japan’s Tankan manufacturing index, and China’s Caixin manufacturing and services PMI data.
- Global: Ongoing fallout from the first US Presidential debate, possible far right majority in France, and results of the three-way Presidential election in Iran between two conservative hardliners and one moderate reformist.
Insights from last week's changes in investor sentiment:
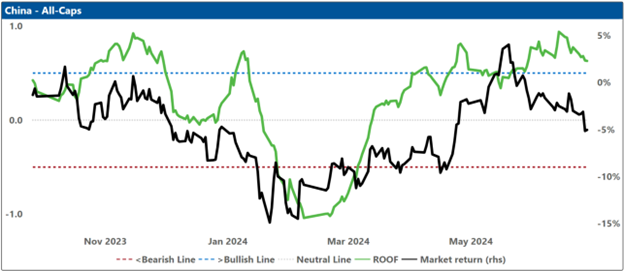
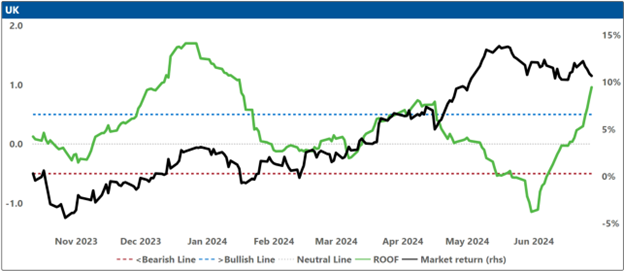
Investor sentiment reverted towards the mean (Neutral) in all markets we follow last week. Investors who were previously bearish or highly negative showed reduced pessimism, while those who were bullish or highly positive tempered their enthusiasm. The sole exception was the United Kingdom, where investors, possibly influenced by the turmoil in France, became more optimistic about their own prospects. Meanwhile, Chinese investors remained bullish, though to a lesser extent than the previous week, as they continue to anticipate further details on the property market rescue package from the authorities.
This week will be predominantly focused on domestic politics, highlighted by three significant elections in France, the United Kingdom, and Iran. Additionally, the repercussions from last week's first Presidential debate between Donald Trump and Joe Biden continue to unfold. Current polling data, including the latest Harvard-Harris poll conducted from June 28-30, indicates a still closely contested race, with Trump leading by a margin of just 4 points (52-48) after the debate. It is important to note, however, that at a similar juncture in 2016, Hillary Clinton was leading Donald Trump by 4.8 points. Betting markets, on the other hand, reflect a less neutral stance, assigning Trump a 62% probability of victory compared to Biden's 20%, suggesting a decisive lead for Trump after the debate. Nevertheless, with the election date set for November 5, there remains ample time for various factors to potentially influence these projections.
The elections in France continue to progress, with Marine LePen's Far Right party currently in the lead, although without securing an outright majority. Investors are keenly observing whether Macron's centrist faction and the far Left can set aside their significant differences to collaborate in preventing her victory in the upcoming second round on Sunday. Presently, equity markets are anticipating a hung parliament scenario, while the bond market suggests that this outcome is merely the lesser of two evils, rather than a clear victory for France. This uncertainty starkly contrasts with the apparent certainty of the Labour Party's success in the upcoming UK general elections this Thursday, where Labour is leading by 20 points.
Unless the FOMC minutes reveal any surprising insights regarding the Federal Reserve's stance on inflation and monetary policy, this week—characterized by numerous elections, a shortened holiday schedule, and an abundance of football—will likely find more investors focused on their televisions rather than monitoring stock prices.
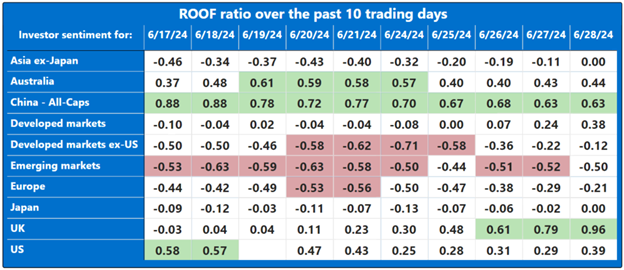
Note: green background = bullish, red background = bearish
Changes to investor sentiment over the past 180 days for the markets we follow:
How to Interpret These Charts:
Top Charts:
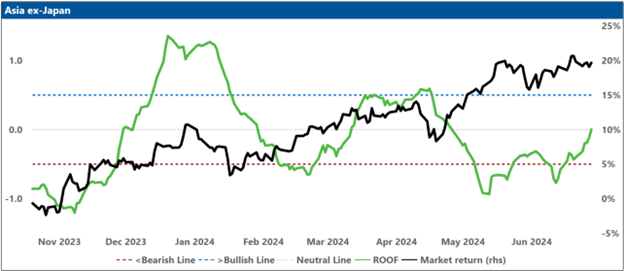
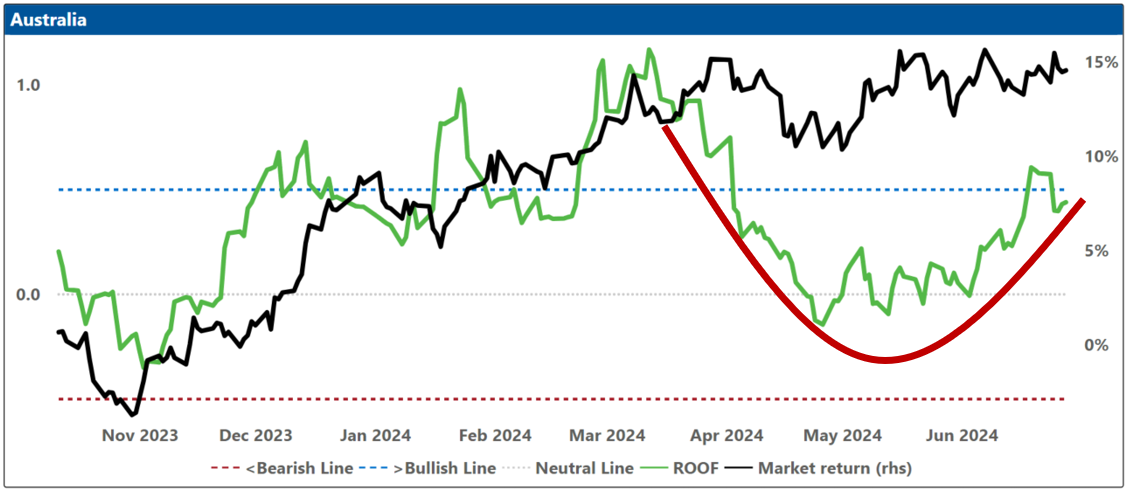
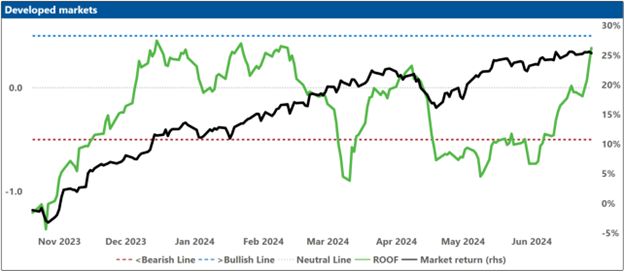
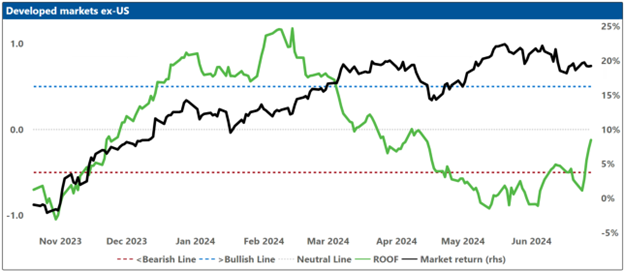
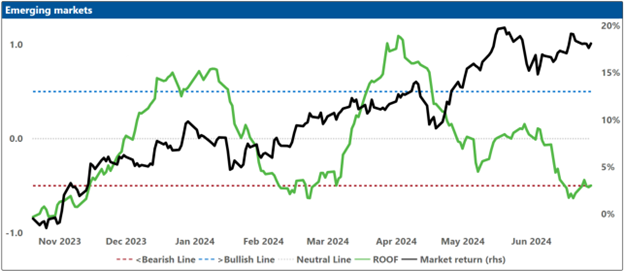
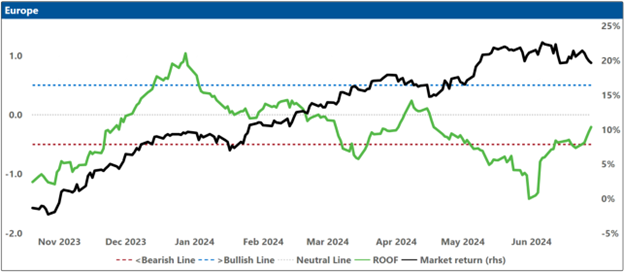
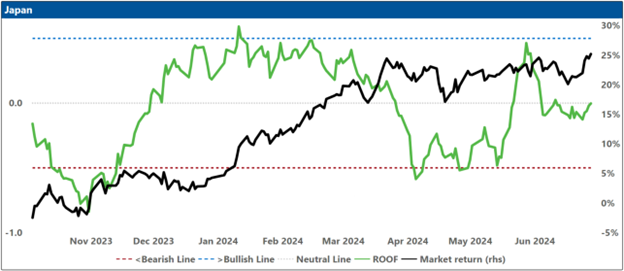
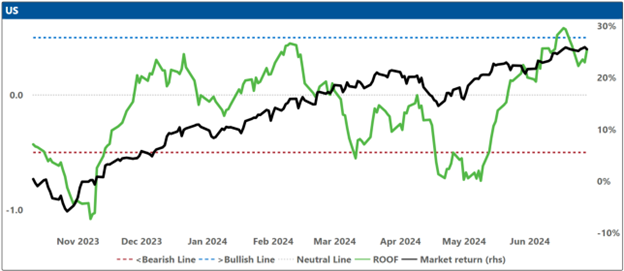
The top charts illustrate the ROOF ratio, which represents investor sentiment. This ratio is depicted in green on the left axis, while the cumulative returns of the underlying market are shown in black on the right axis. Key reference lines include:
- A horizontal red line at -0.5 (left axis), marking the threshold between negative sentiment (-0.2 to -0.5) and bearish sentiment (< -0.5).
- A horizontal blue line at +0.5 (left axis), indicating the boundary between positive sentiment (+0.2 to +0.5) and bullish sentiment (> +0.5).
- A horizontal grey line at 0.0 (left axis), around which sentiment is considered neutral (-0.2 to +0.2).
Bottom Charts:
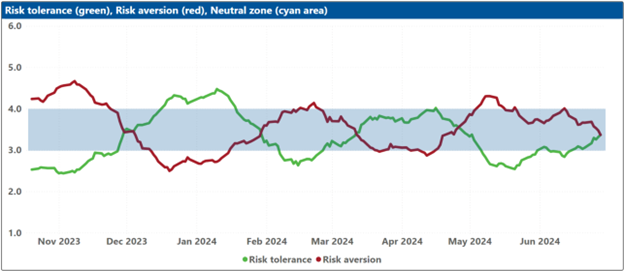
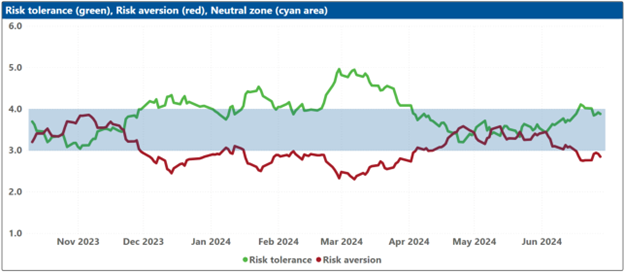
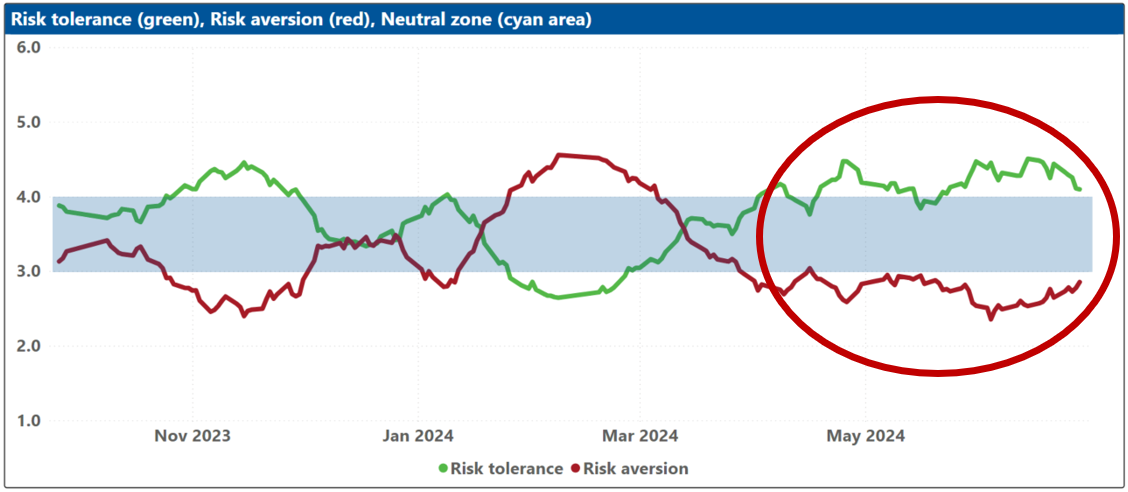
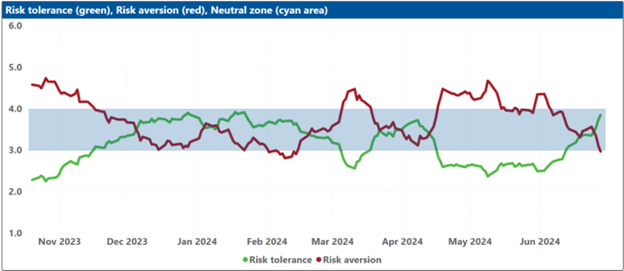
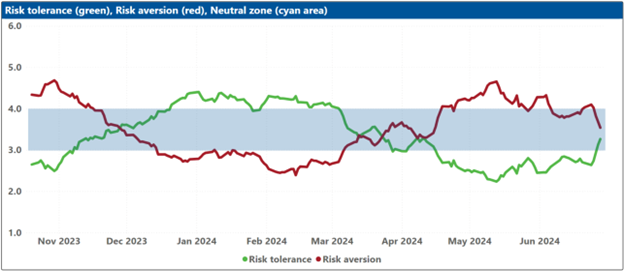
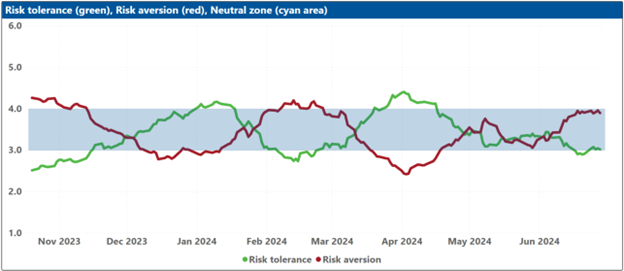
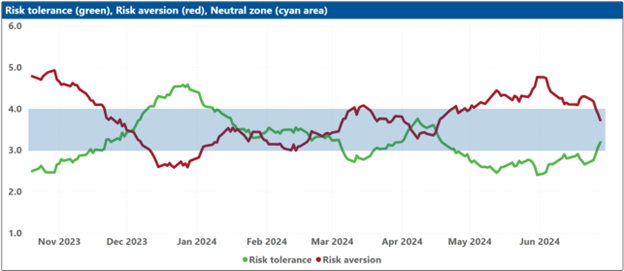
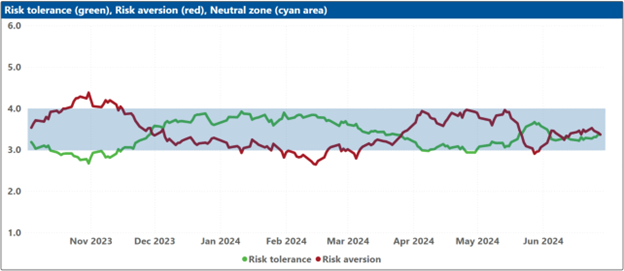
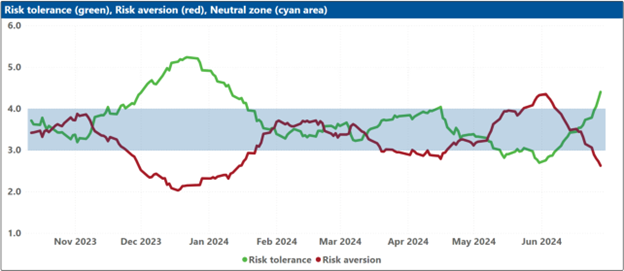
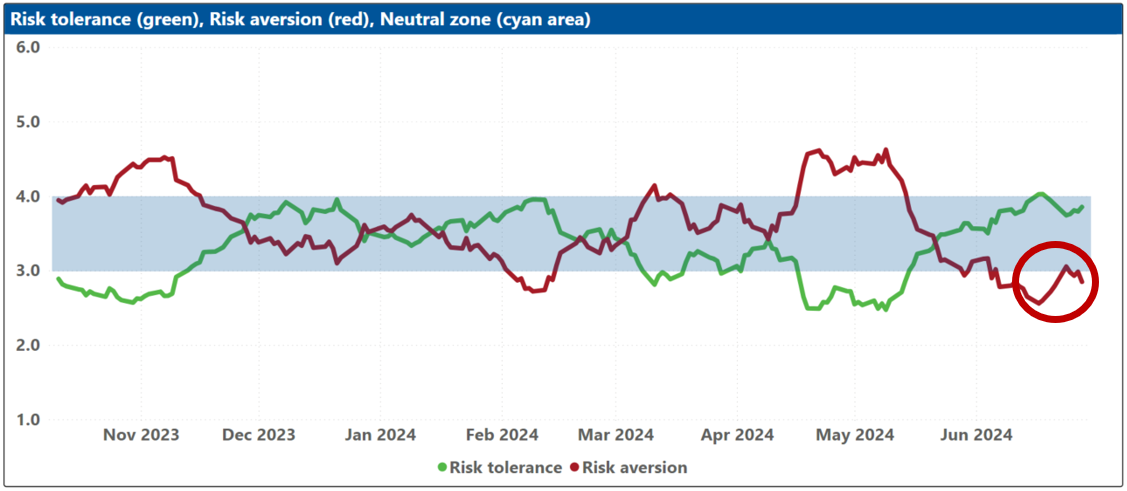
The bottom charts display the levels of risk tolerance (green line) and risk aversion (red line) within the market, representing investors' demand and supply for risk, respectively. Key insights include:
- When risk tolerance (green line) exceeds risk aversion (red line), more investors are willing to buy risk assets than there are investors willing to sell them at the current price. This scenario forces risk-tolerant investors to offer a premium to entice more risk-averse investors to trade, thereby driving markets upward.
- Conversely, when risk aversion (red line) surpasses risk tolerance (green line), the market dynamics reverse.
The net balance between risk tolerance and risk aversion levels is used to compute the ROOF ratio shown in the top charts, reflecting the sentiment of the average investor in the market.
Blue Shaded Zone:
The blue shaded zone between levels 3 and 4 for both indicators signifies a reasonable balance between the supply and demand for risk in the market. When both lines remain within this blue zone, the market is considered stable. However, when both lines move outside this zone, the significant imbalance in demand and supply for risk can lead to overreactions to unexpected news or risk events.