
EQUITY RISK MONITOR HIGHLIGHTS
WEEK ENDED NOVEMBER 8, 2024
Note to our readers: this is a longer-than-usual version of our weekly highlights, as we focus on how the US election impacted returns and risks. We will return to highlighting the charts included in our equity risk monitors next week
Market/Election recap
Those who follow the betting markets may not have been surprised that Trump won the US election, and poll watchers knew there was a roughly 50-50 chance. The sharp reaction of the US market, however, suggests that some investors may not have anticipated the win, or perhaps it was the Republican sweep that changed their minds. After the election results were known they voted with their dollars, sending the US market roughly 4% higher, and to new highs for some indices, over the next three days.
Market gains came with substantial performance rotation in sectors and style factors, however, and predicted volatility soared. In fact, the increase in risk for the Russell 1000 index according to the Axioma short-horizon fundamental model fell close to the 99th percentile of three-day increases since the inception of the model. The current level of risk, in contrast, remains just above the long-term median.
Many of the bigger three-day risk increases historically were related to the 1987 market crash, the height of the Global Financial Crisis, the bursting of the internet bubble and the onset of the Covid crisis. In other words, we may feel good about the market’s gains, but they came with an unusually large increase in volatility, the magnitude of which has often been associated with down markets and crisis times. We also note that short-horizon risk for developed markets ex-US barely budged, which is a bit puzzling given the potential US election impact on global economies.
Total market risk jumped
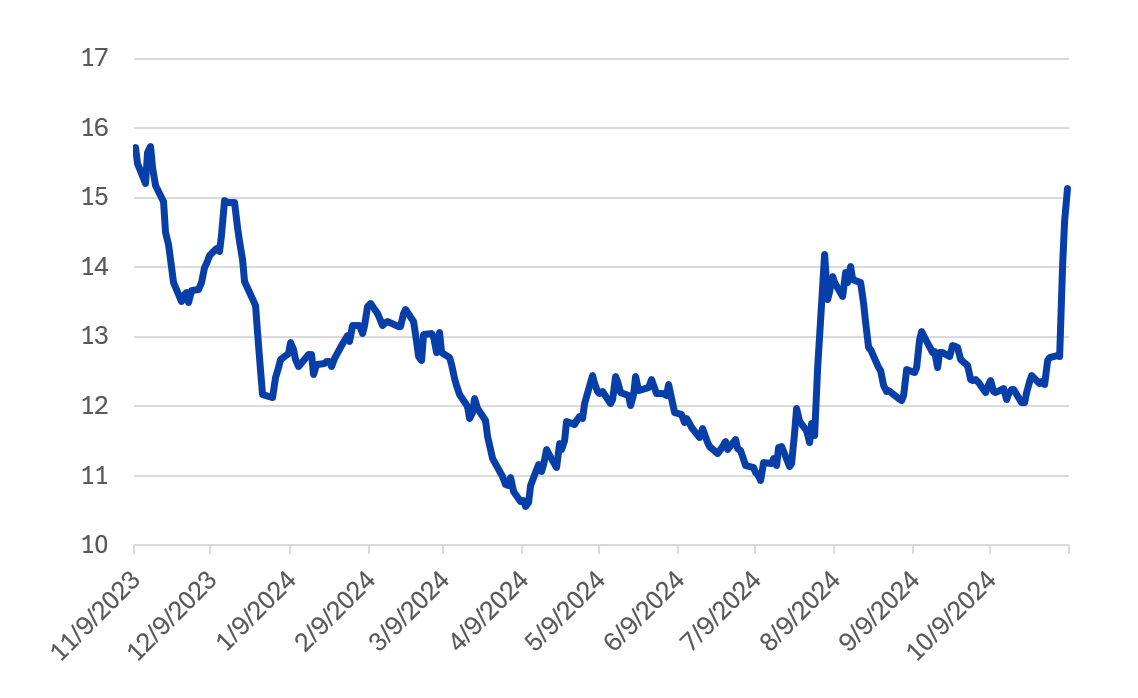
Overall, as noted, market risk as measured by the US5 short-horizon fundamental model and the Russell 1000 gained almost 20% proportionally from the close on November 5 to the close on November 8, one of the biggest three-day increases in volatility in the history of the US5 model (Figure 1). For US4 model users, the gain according to that model was slightly smaller, but still in the 98th percentile relative to history. The level of risk is still below where it was a year ago, though.
Figure 1. Short-horizon predicted risk, Russell 1000, according to the Axioma US5 fundamental model
Style factor performance
Many style factors in Axioma’s US5 model saw their performance flip from the period leading up to the election to the few days post -results (Figure 2). The most notable change was in the Exchange Rate Sensitivity factor, which was down 42 basis points over the five days before the election (meaning stocks that do well when the US dollar weakens fared better). In just the three days after the election the factor return was about 1.7%, indicating a strong expectation of future strength in the US dollar. Medium-Term Momentum was lagging in the pre-election week, down 0.4%, but it also turned an about-face to a gain of 1.4%, as investor favor went back to those stocks that had been doing well earlier this fall.
The Profit Quality factor was strong in the days before the election, up more than 1%, but as investors took on more risk on Wednesday of last week its three-day return, while still positive, was a much lower 15 basis points. Both Downside Risk and Residual Volatility saw returns flip from negative to positive as well, another signal that investors were feeling risk tolerant once again. The return to the Crowding factor was 0.23% pre-election and -0.17% post-election as investors sought to change their portfolio profiles. Most returns in both periods were much higher than average in magnitude.
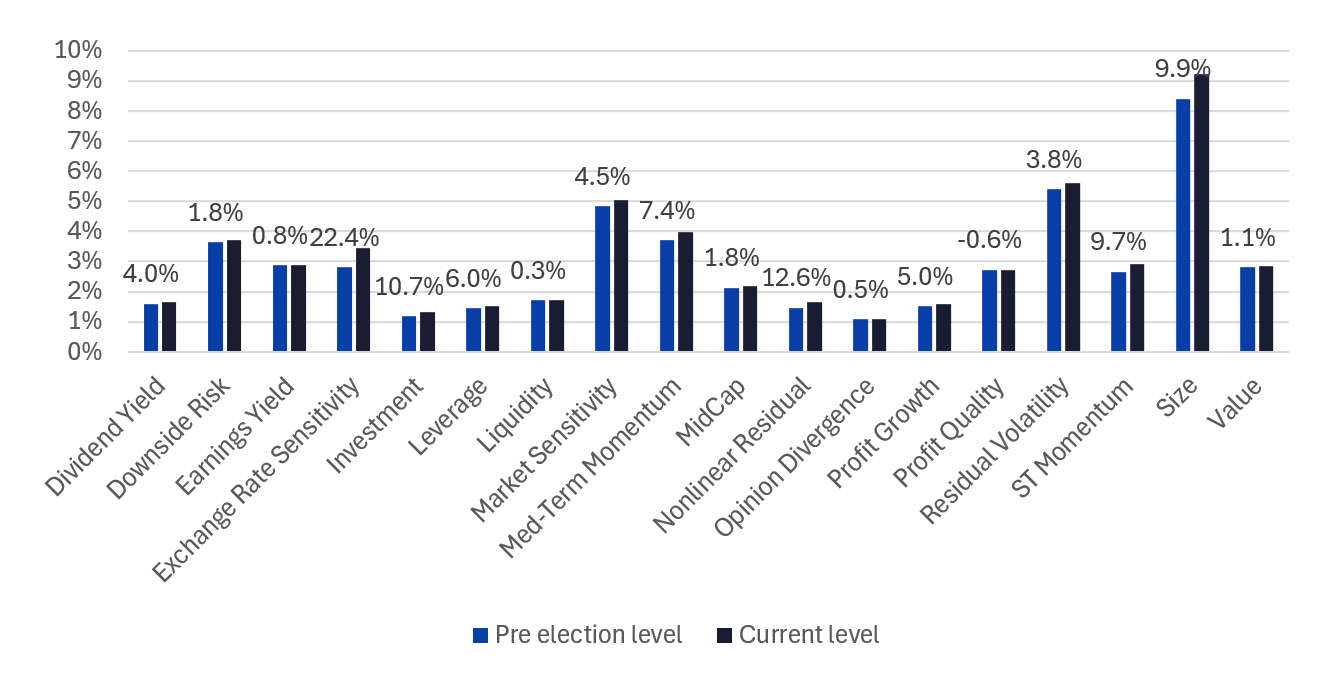
At the same time, every factor in the model experienced an increase in volatility (Figure 3). Risk for the Non-linear Residual style factor increased the most, more than 12%, although the level stayed low, suggesting non-linear market behavior (e.g. mega-caps and smaller caps doing well). The Size factor, already the highest of all the model factors, also saw a big increase in volatility, almost 10%.
Figure 2. Factor returns: five days leading up to the election vs. three days post election
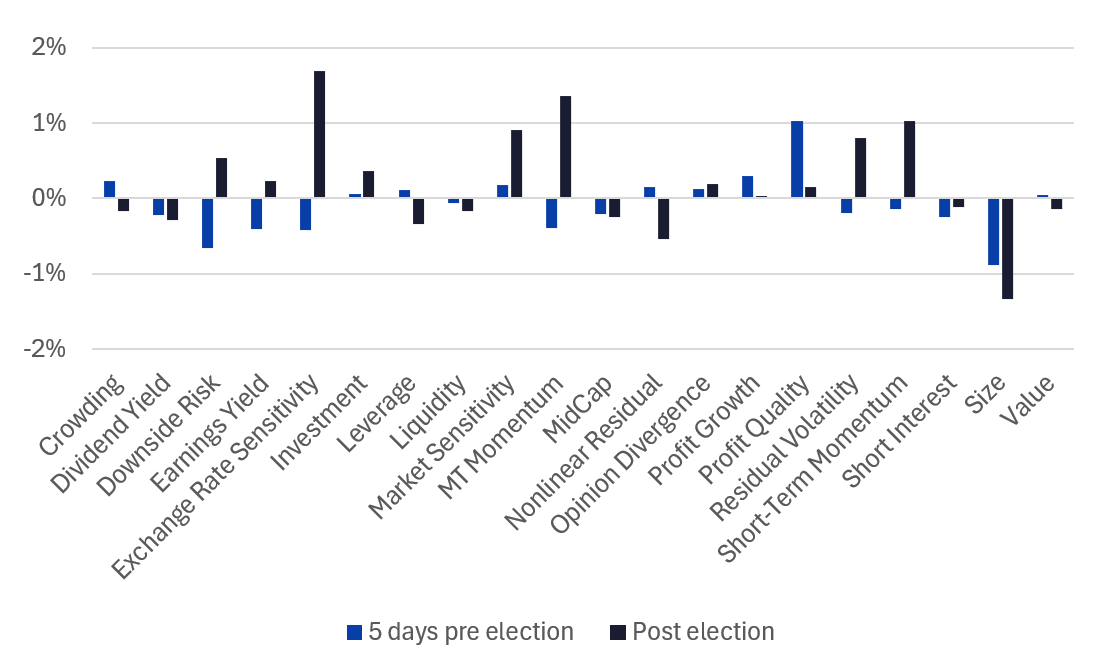
Figure 3. Predicted short-horizon volatility pre and post election, with proportional change noted
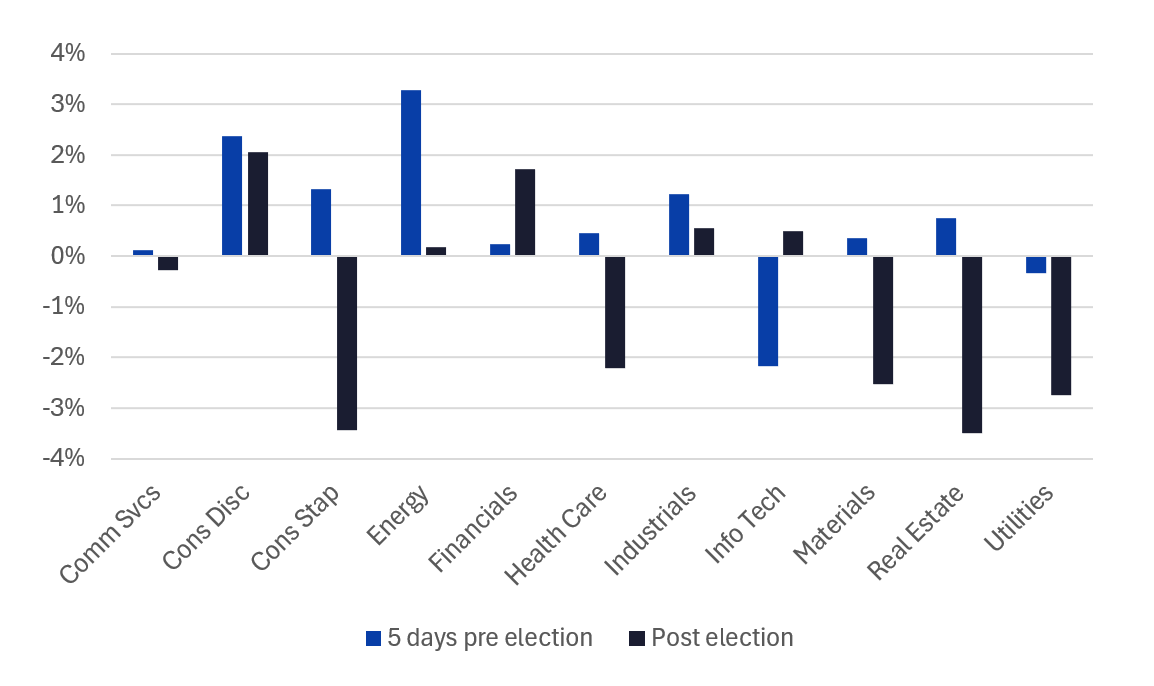
The market was down slightly in the week before the election, but, as noted, soared afterward, with all 11 GICS sectors posting gains (Figure 4). However, as we saw for factors, sectors also saw some big reversals in fortune, at least on a relative basis (Figure 5). Financials and Consumer Discretionary were the biggest winners post November 5, while sectors sensitive to higher interest rates, particularly Real Estate and Utilities, lagged. Technology had the most negative return pre election, but turned around afterward.
Figure 4: Absolute sector returns: five days leading up to the election vs. three days post election
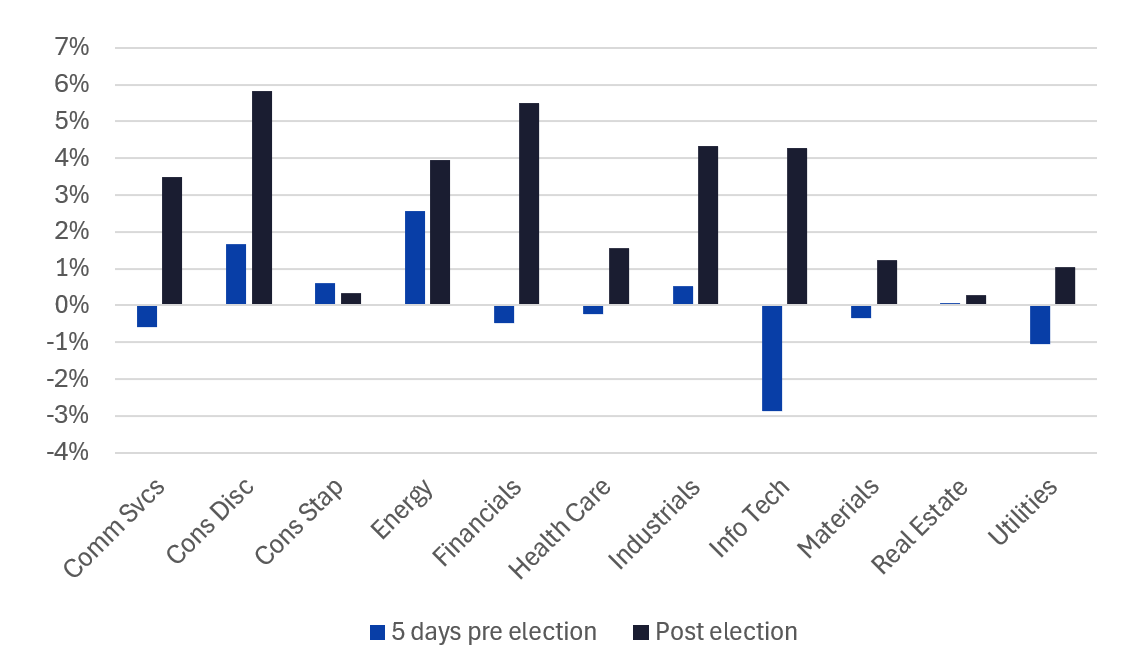
Figure 5: Relative sector returns: five days leading up to the election vs. three days post election
All sectors saw risk increases
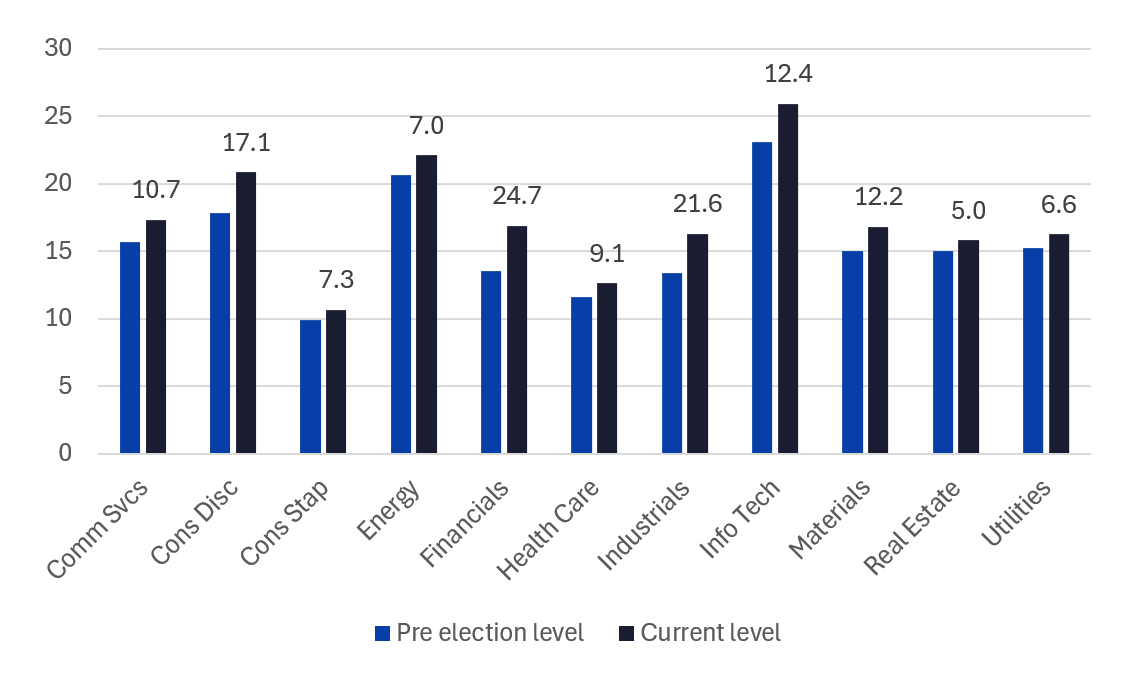
Sector risk rose across the board from before the election to after (Figure 6). Financials and Industrials both saw their volatility increase by more than 20%, and Consumer Discretionary’s was up 17% and Information Technology’s rose more than 12%.
Figure 6. Predicted short-horizon sector volatility pre and post election, with proportional change noted
Active risk likely rose with total risk
Active managers will probably want to look more deeply into their portfolios’ tracking error as well. Much of the increase in total risk was the result of higher market risk, but specific risk also rose substantially. And, as we have shown, the relative risks of some style and sector factors were up as well, so managers taking those bets may want to reevaluate their current risk/return status.
See the US4 and US5 Equity Risk Monitors for more details on the post-election changes in the US market.
You may also like


