EQUITY RISK MONITOR HIGHLIGHTS
WEEK ENDED OCTOBER 11, 2024
Volatility in China continues with another Reversal
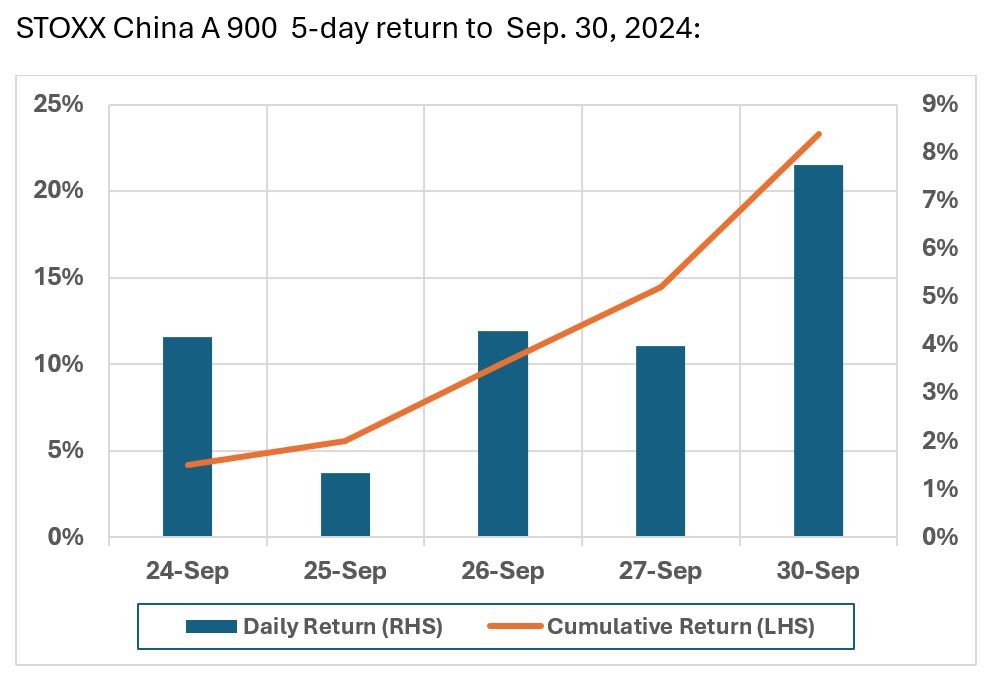
On the week ended September 27th, we dedicated the entire Risk Monitor Highlights to the stimulus-related surge in the Chinese equity market. We did not capture the full effect, with the wave cresting on the last day before a six-day trading hiatus. Including Monday the 30th in the 5-day return from the announcements of September 24th, the STOXX© China A index was up a whopping 23.3%:
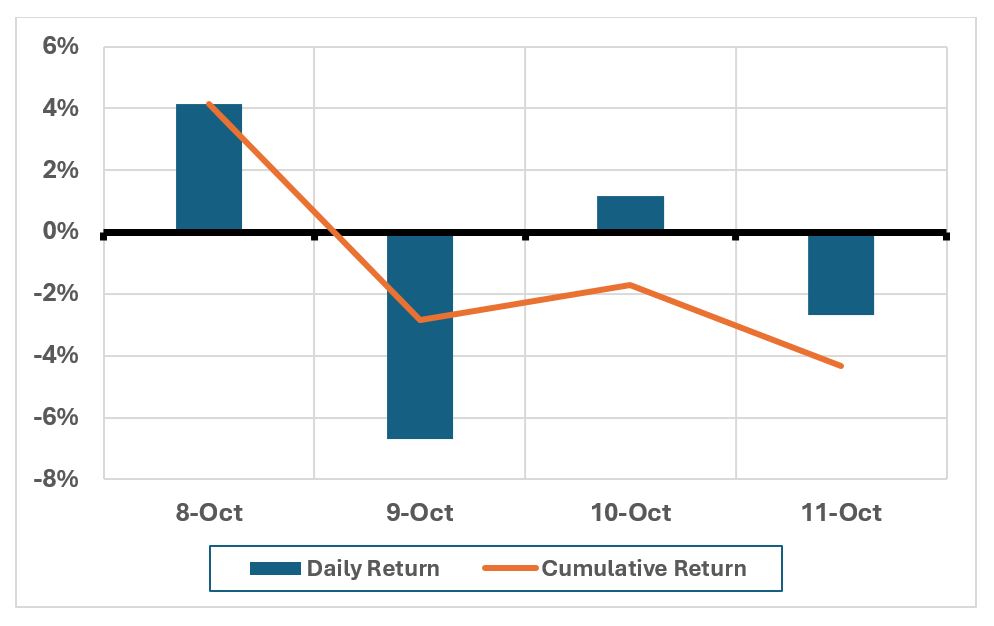
Upon re-opening last Tuesday after the “Golden Week” holiday celebrating the founding of the modern Chinese state, the trend seemed to continue with a 4.1% daily return, but the next day saw a 6.7 point reversal, a magnitude similar to the nearly 8% gain experienced on the 30th of September:
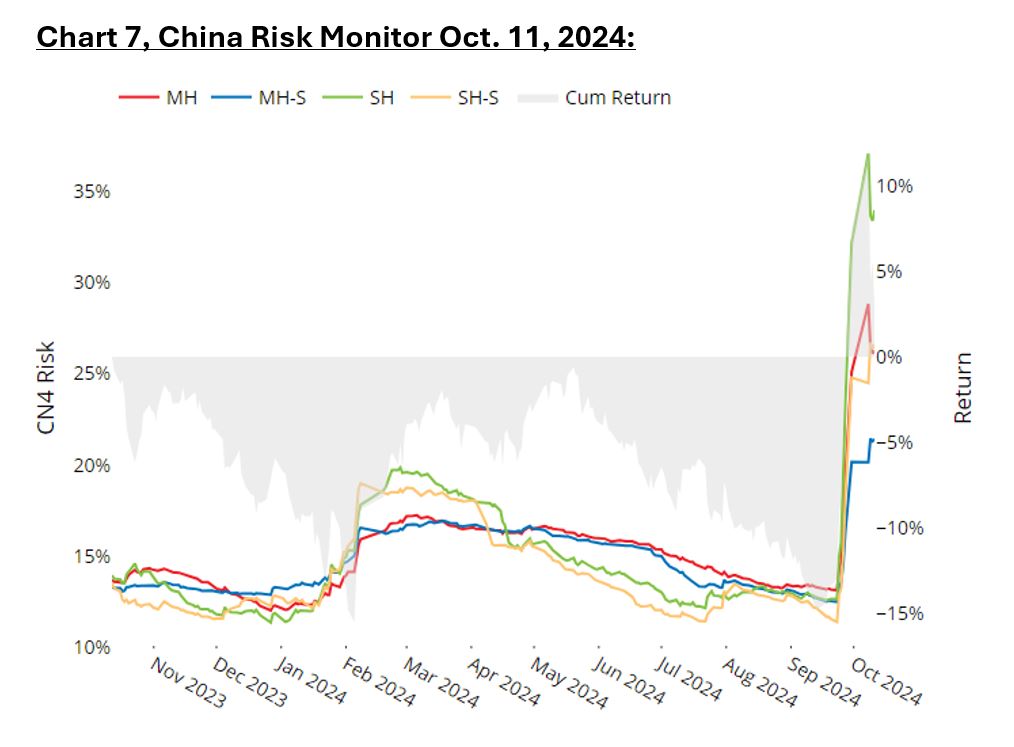
As we had pointed out, forecast risk levels jumped in response to the outsize daily returns, nearly doubling in the medium horizon models, and tripling in the short-horizon models. Looking at the chart in the risk monitor which displays a rolling 12-month trailing window reveals how large the change was relative to the long-term trend, but the longer window can make it difficult to assess the immediate impact, so we zoom in here on the change from the 23rd of September, before the announcement of the stimulus packages, and the end of last week:
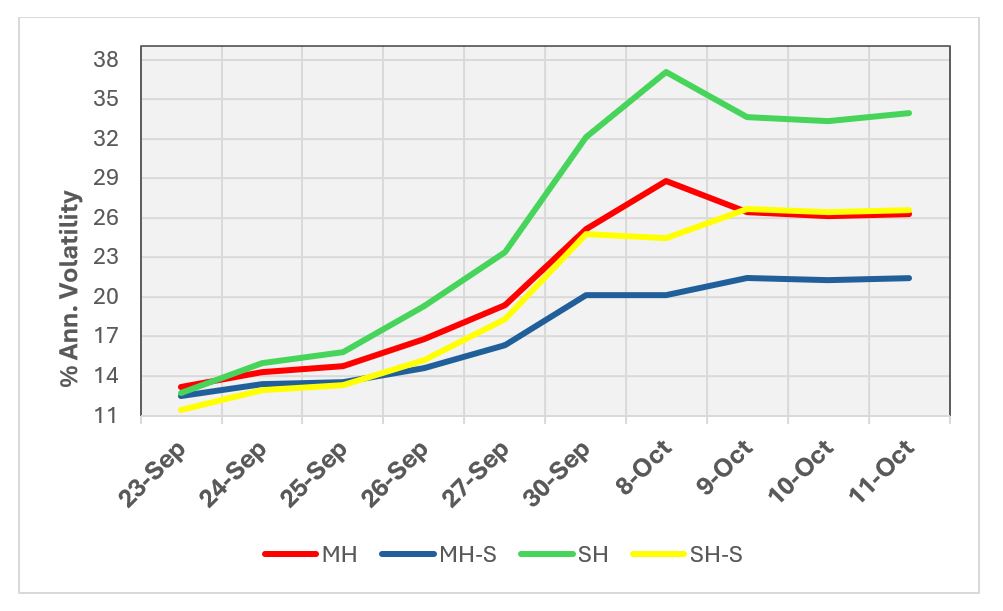
To be put into some context, the realized annualized standard deviation of the 9 daily returns before and after the Golden Week holiday is 68.7%. The short horizon fundamental model is forecasting risk at about half that level currently as it utilizes a half-life of 60 days to estimate factor volatilities and 125 days to estimate factor correlations. Extrapolating annualized risk from a 9-day series of returns would not be prudent for obvious reasons, but it serves to show how extreme those daily returns have been in the context of the annualized risk numbers we are accustomed to using.
You may also like