EQUITY RISK MONITOR HIGHLIGHTS
WEEK ENDED JUNE 21, 2024
Axioma Risk Monitor: Nvidia responsible for nearly 20% of US market risk; Industry and Specific risks at record highs in US; Similar asset diversification in the US and Developed Markets ex-US despite different concentrations
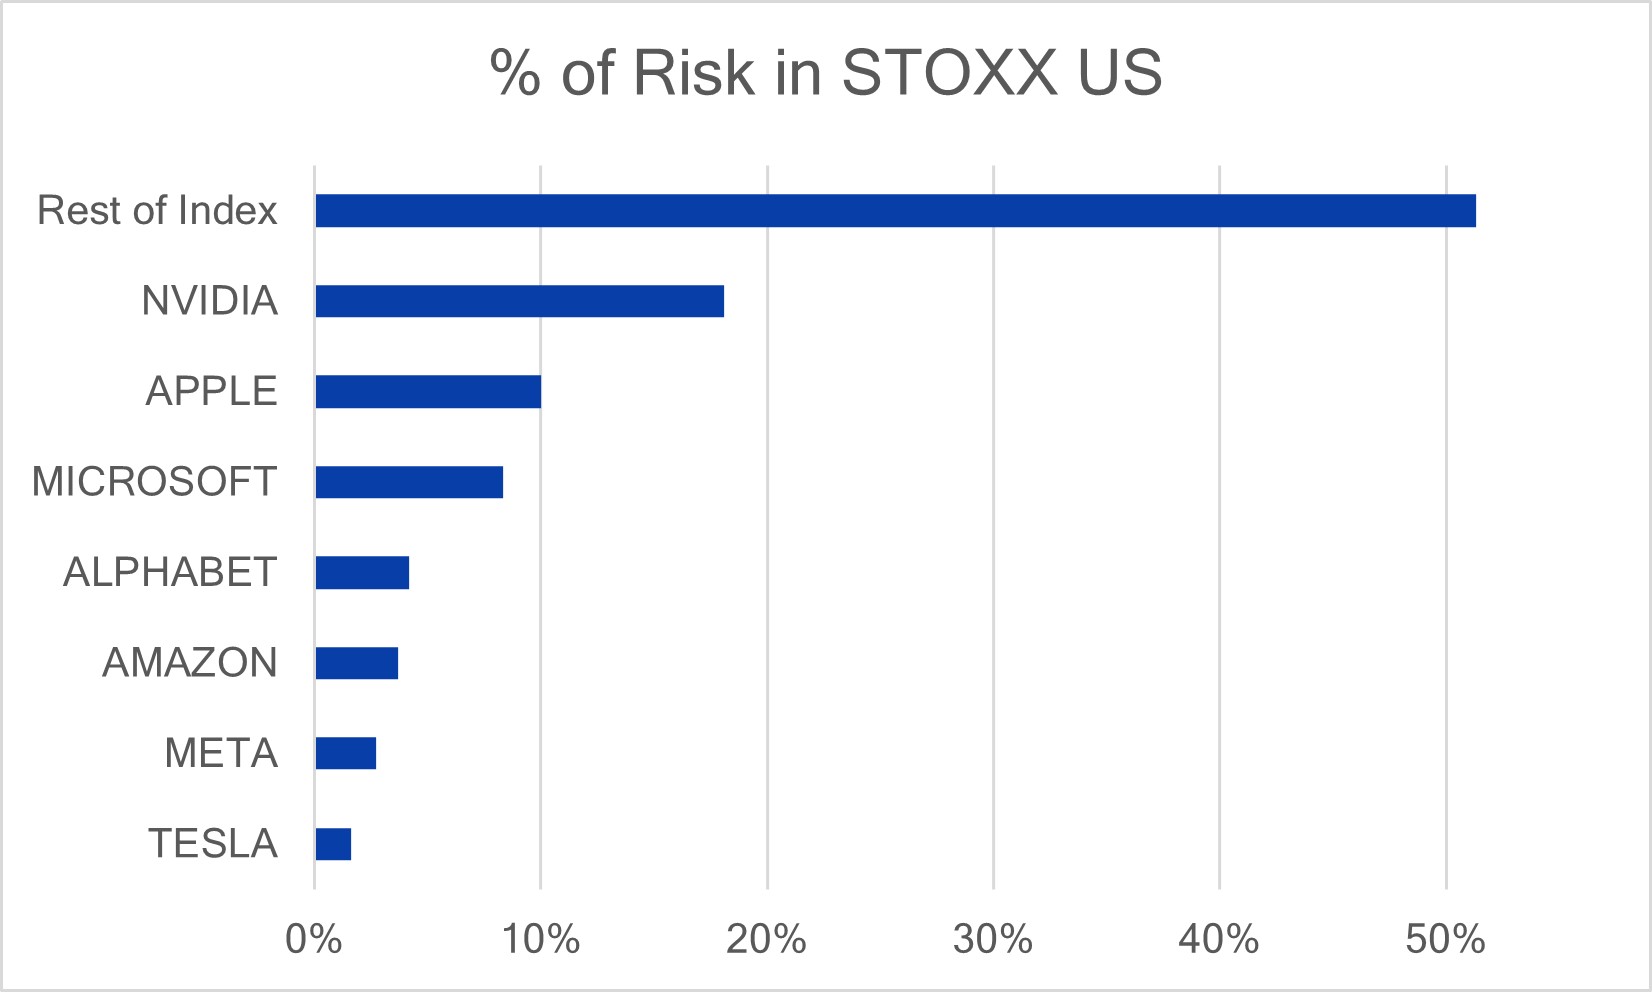
Nvidia responsible for nearly 20% of US market risk
Nvidia not only became the largest US company, surpassing Microsoft and Apple, but it is by far the largest single contributor to the US market risk. While its weight in the STOXX US index is about 7%, it contributes nearly 20% to the US benchmark risk, as measured by Axioma US fundamental short-horizon risk model. In contrast, Apple and Microsoft combined weight is 13% and together contribute the same amount of risk as Nvidia alone. In fact, half the US market risk is driven by the Magnificent Seven. For more details on the Magnificent Seven influence on the US market see blogpost: Granola entice but Magnificent Seven deliver (A visual story).
We saw first-hand the large impact of Nvidia’s volatility on the US market last week. After marching up in the beginning of the week pushing US indices to new records, Nvidia shares plunged 4%, pushing down the US market about 28 basis points. Still, the US market was able to eke nearly 1% gain, aided by Microsoft, Amazon and Google, among other 430 US companies that were up last week. Year-to-date however, Nvidia’s performance of 156% is astonishing, while the US market rose 15%. Nvidia is responsible for one tenth of the US market year-to-date gain as of last Friday.
The following chart does not appear in the Equity Risk Monitors, but is available on request:
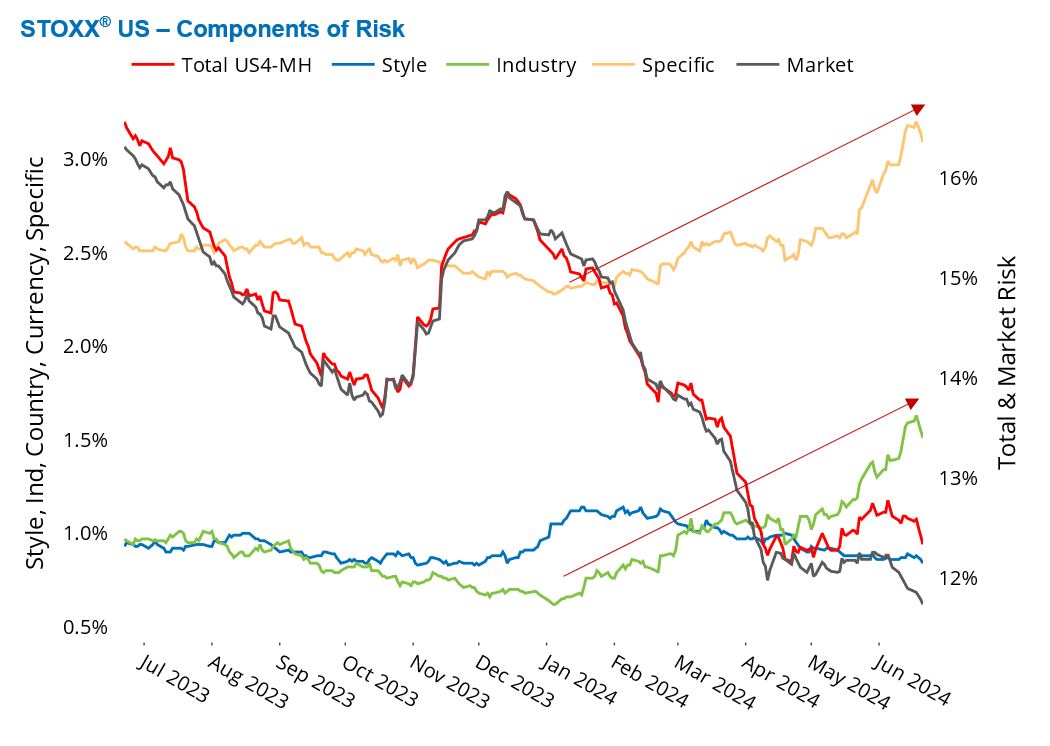
Industry and Specific risks at record highs in US
The US Industry and Specific risks rose to record highs this year, but since Market risk—the main driver of benchmark risk—was down, total risk for the STOXX US index still declined. Style risk was also down slightly, pushing total risk further down, as measured by Axioma US fundamental medium-horizon model.
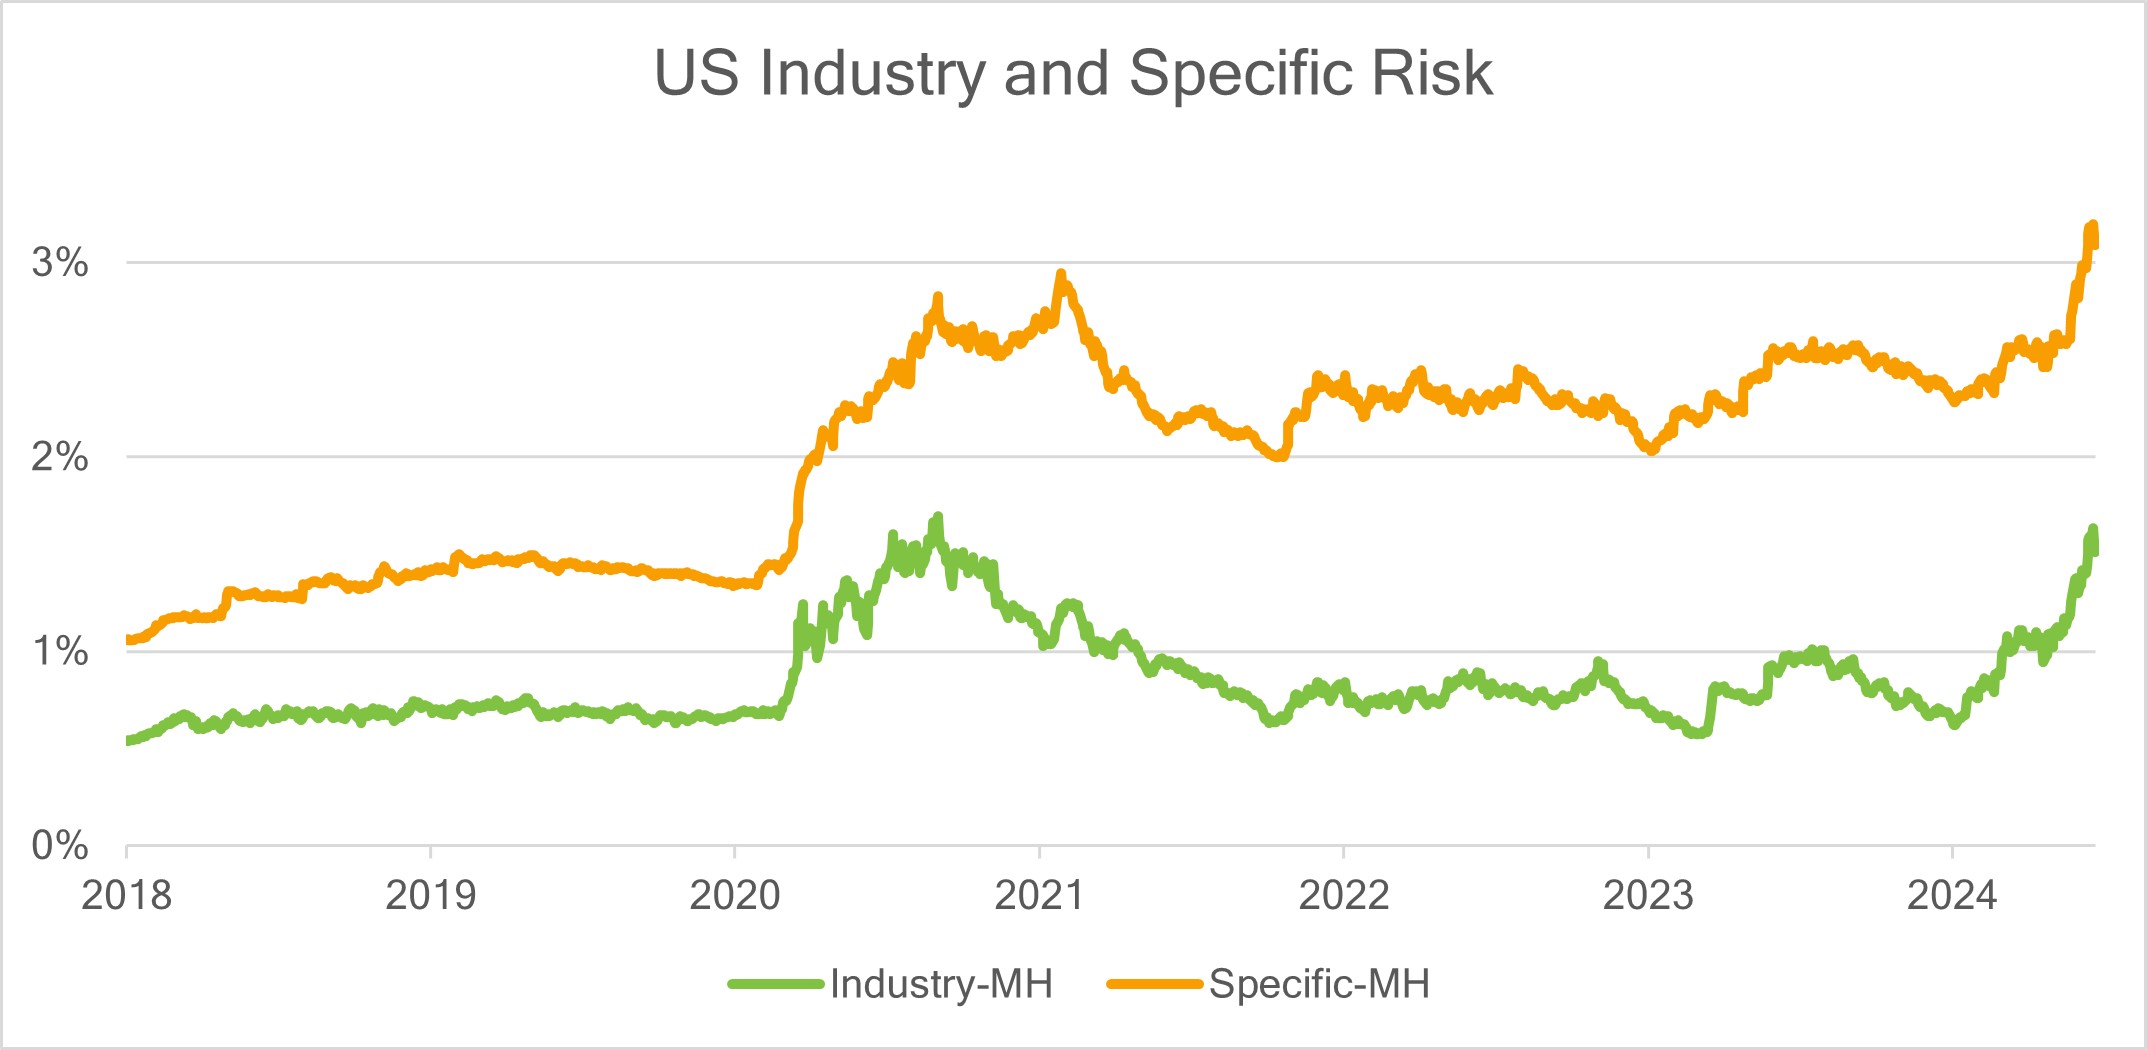
Specific risk is now at the highest level we have seen in at least five years. Nvidia is responsible for 44% and Magnificent Seven for 91% of the current level of STOXX US specific risk. While specific risk is only a small part of total benchmark risk, it is likely to figure far more prominently in actively managed portfolios.
Among these seven tech giants Microsoft is the least volatile (21%) while Nvidia and Tesla have the highest volatilities (of over 45%) followed by Apple (31%). Nvidia and Apple have witnessed an increase in risk this year, while the other Magnificent Seven’s risk declined.
Industry risk for the STOXX US index has more than doubled since the beginning of the year and is now at levels not seen since the COVID pandemic in 2020. Information Technology dwarfed most other US sectors, having a 40% weight in the STOXX US index and a 56% contribution to the US benchmark risk. Information Technology is also the only one among the 11 GICS sectors in the US index to record an increase in risk over the past year, as measured by Axioma US fundamental medium-horizon model.
See graph from the STOXX US Equity Risk Monitor as of 21 June 2024:
The following chart does not appear in the Equity Risk Monitors, but is available on request:
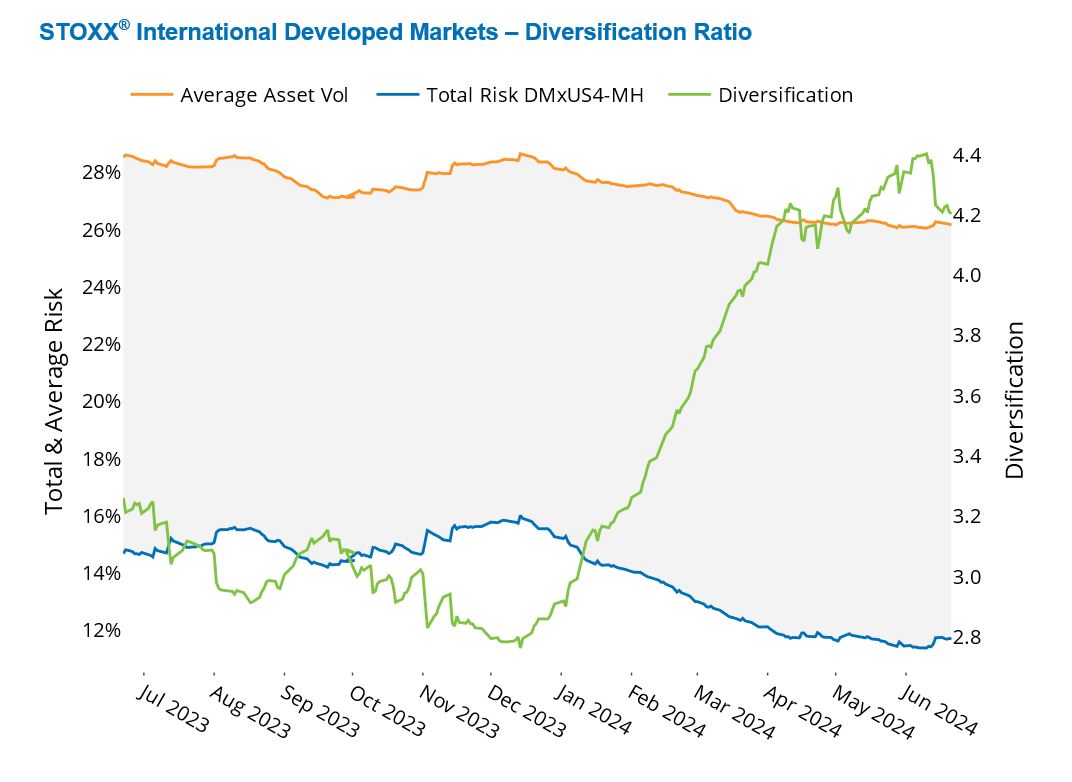
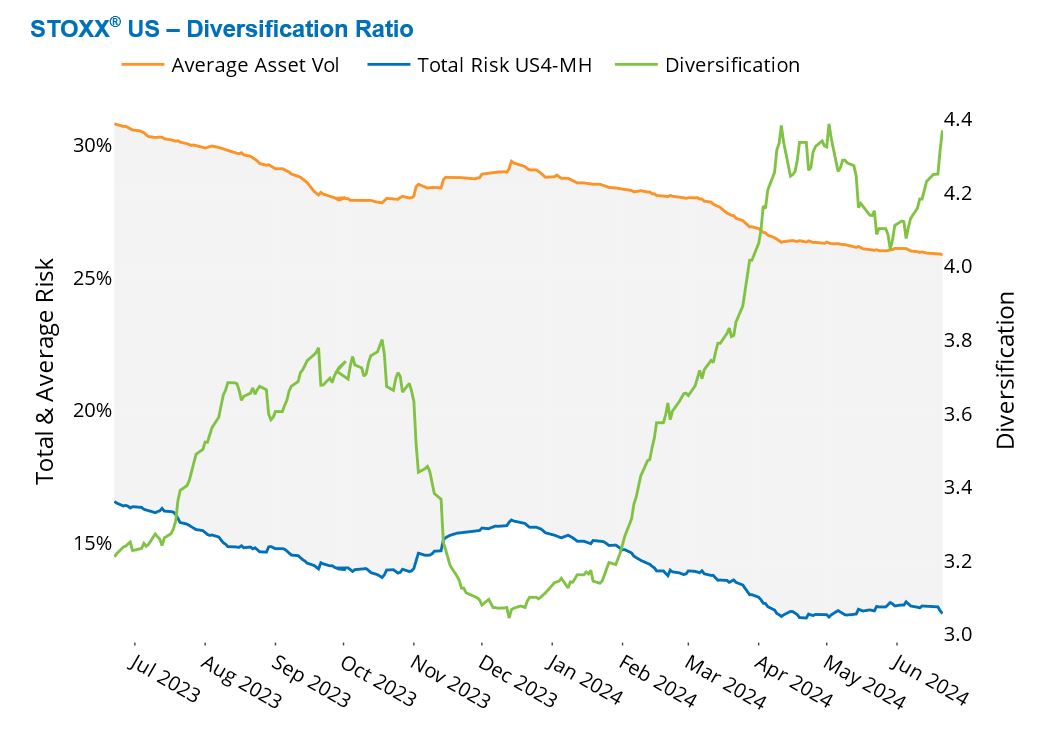
Similar asset diversification in the US and Developed Markets ex-US despite different concentrations
Despite having a smaller number of constituents and a much higher concentration, the STOXX US index exhibits a similar asset diversification ratio as the STOXX International Developed Markets index.
With nearly 600 constituents, the STOXX US index has an effective number of names of 53, indicating that less than 10% of its members dominate it. The STOXX International Developed Market index has about 1000 constituents and an effective number of 232, indicating 20% of names drive the index.
The STOXX International Developed Market index’s diversification ratio skyrocketed since January, hit a 12-month high at the beginning of June and dipped to 4.2 last week, as measured by the Axioma Developed Markets ex-US fundamental short-horizon model. The ratio in the STOXX US index rose to a one-year peak in April, dropped in May, only to retrace its steps and end at 4.4 last week, as measured by the Axioma US fundamental short-horizon model.
The asset-diversification ratio is calculated as the weighted sum of asset variances for each stock in the index divided by the total forecasted index variance. The higher the ratio, the lower the implied average correlation amongst index members.
See graph from the STOXX US Equity Risk Monitor as of June 21, 2024:
See graph from the STOXX International Developed Markets Equity Risk Monitor as of June 21, 2024: