
Axioma ROOF™ Score Highlights
WEEK OF APRIL 22, 2024
Potential triggers for sentiment-driven market moves this week:*
- US: Q1 GDP growth rate, PCE prices, and personal income and spending data. Durable goods orders as well as Manufacturing and Services PMI data. On the earnings front, over 30 large caps will be reporting this week including Tesla, Visa, IBM, Amazon, Ford, Spotify, and AT&T.
- Europe: Eurozone consumer confidence data as well as 2023 figures on government debt and budget for the region.
- APAC: Interest rate decisions in China (BoC) and Japan (BoJ). Japan PMI and Tokyo inflation data.
- Global: Geopolitical events can turn yesterday’s action plan into tomorrow’s unthinkable. Be prepared. Be very prepared.
* If sentiment is bearish/bullish, a negative/positive surprise on these data releases could trigger an overreaction.
Insights from last week’s changes in investor sentiment:
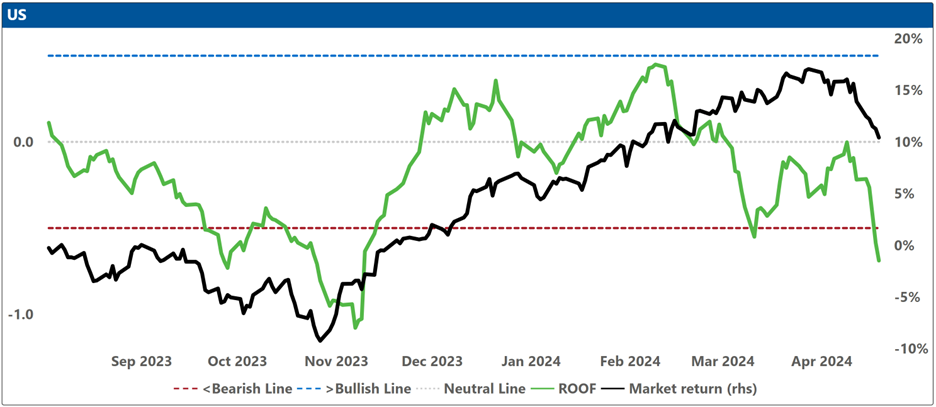
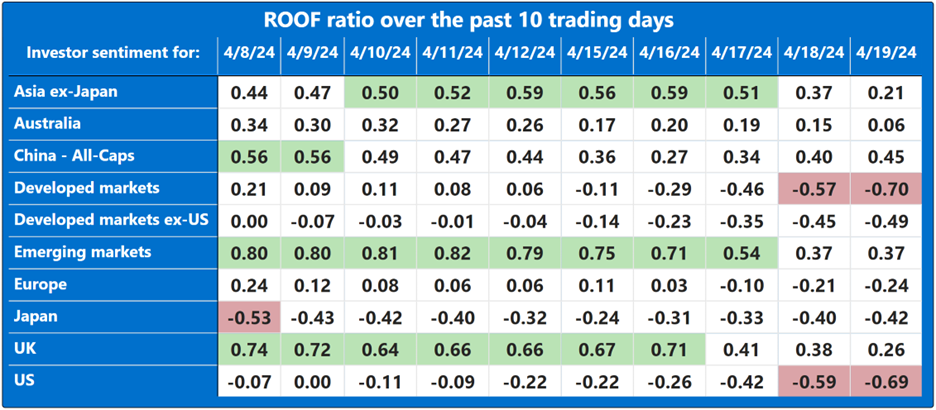
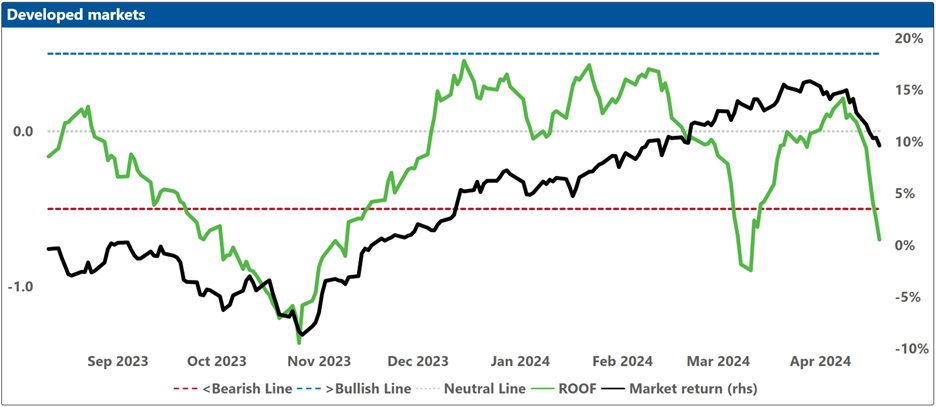
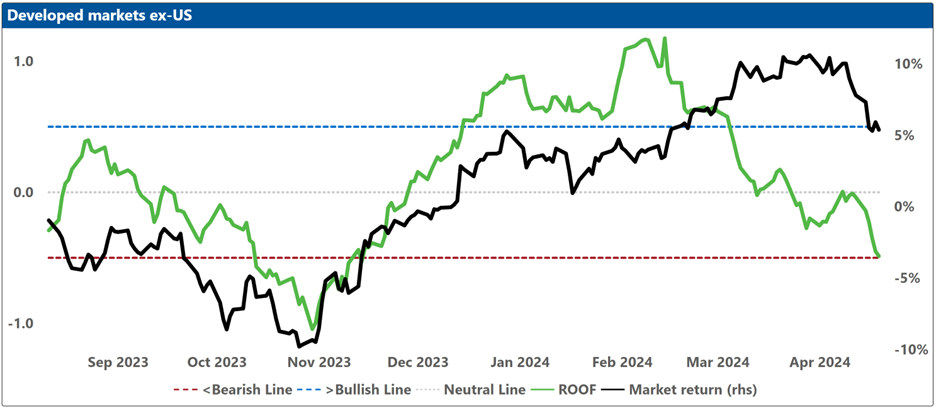
Investor sentiment fell sharply last week led by US investors who turned bearish on the twin disappointments of fading hopes for a Fed rate cut and increased tensions in the Middle East.
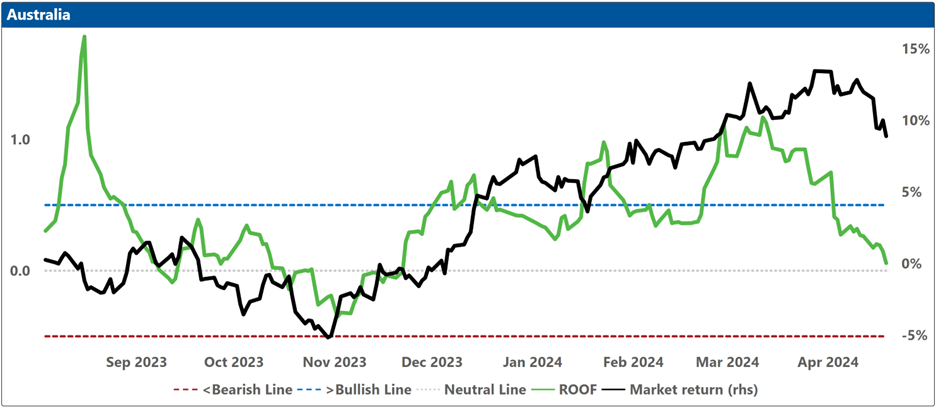
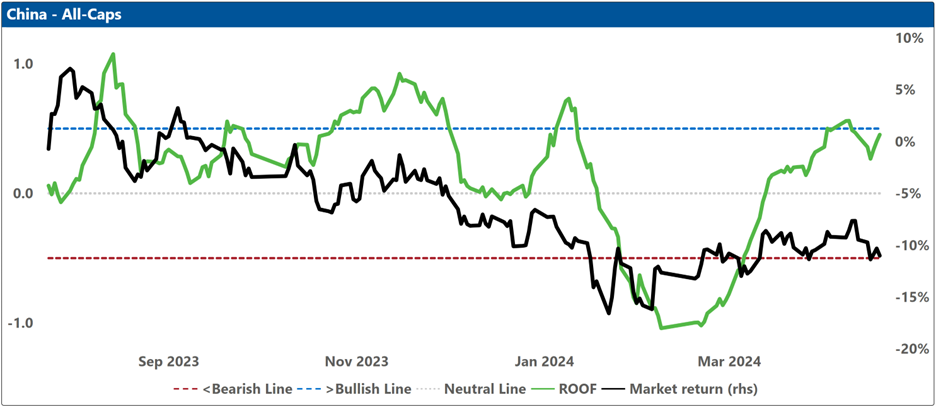
The only market not to suffer a decline in sentiment last week was China where positive economic data continues to support the narrative that the economy may have bottomed out. Elsewhere, the sudden decline in sentiment came from the same risk aversion fund from which investors commonly draw when faced with an uncertain world with no concrete connect-the-dot justification for its sudden randomness.
Tensions in the Middle East: With a characteristically straightforward if counterproductive approach to resolving a conflict, tensions between Israel and Iran have entered previously untested territory (terra cognita between those two enemies was the diplomatic or proxy group route, not the direct hit one). The tit-for-tat military strikes (clearly designed as just a missive of displeasure) seem the new communication protocol between the two enemies. And for investors, nothing was lost in translation.
Fed interest rate cut: To get inflation down to the Fed’s 2% target (and “confidently” stay there), the economy has to slow down. And if raising interest rates eleven consecutive times to a 23-year high and keeping them there for a year (July ’23 – Jul ’24) hasn’t (yet) slowed the economy down, how is cutting them at the July meeting going to accomplish that? The next FOMC meeting after July is in September. The Presidential race will be in its ninth inning by then. The meeting after that is on November 7th – talk about last minute! Any action by the Fed this close to election day (November 8) will be seen as political interference. Perhaps, when Christine Lagarde said “the ECB is data-dependent, not Fed-dependent”, what she really meant was that the ECB is not POTUS-dependent. And while it’s not immediately clear whether investors were aware of the phrase’s loaded nature, many of them seem to have heard a dog whistle.
The global economy remains more robust than expected, led by consumer spending (how is anyone’s guess), leaving it vulnerable to any geopolitical shocks to the global supply chain (been there, seen that) and keeping central banks focused on its ugly offspring, inflation.
Markets are sometimes riveting, sometimes moving, oftentimes frustrating, but ultimately, always right. The message they sent last week was unanimous: “A rate cut is not coming, stop betting on one”.
Changes to investor sentiment over the past 180 days for the markets we follow:
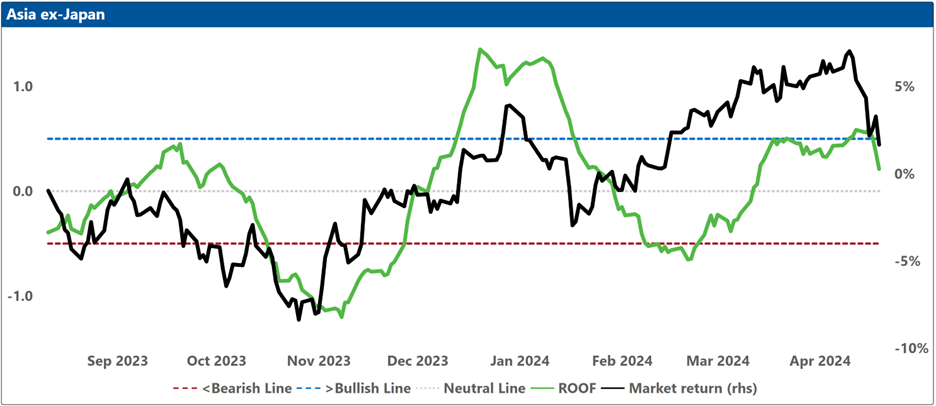
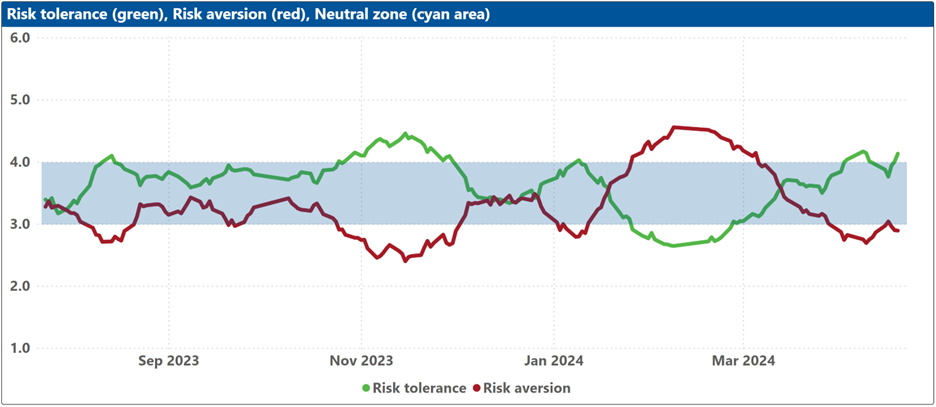
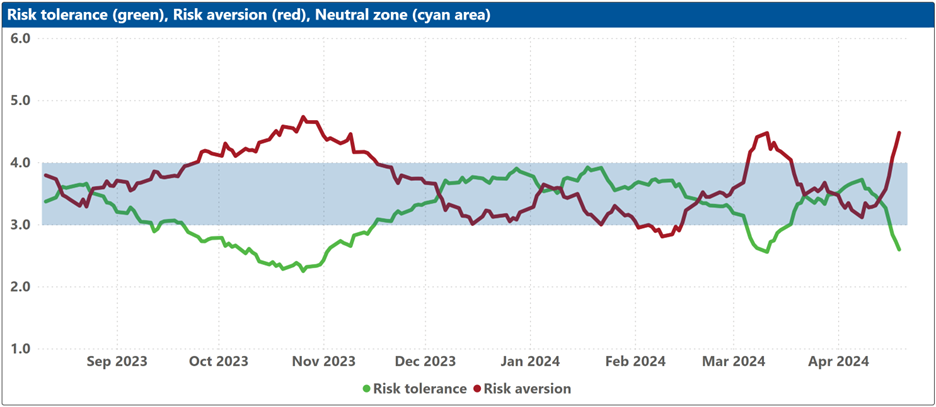
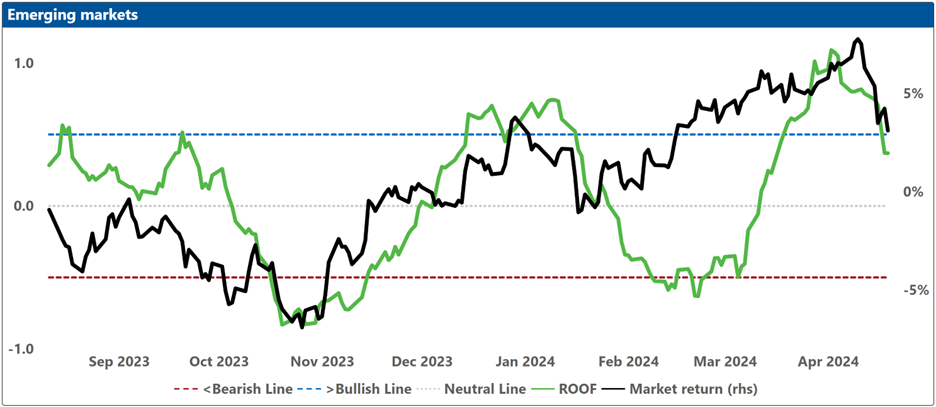
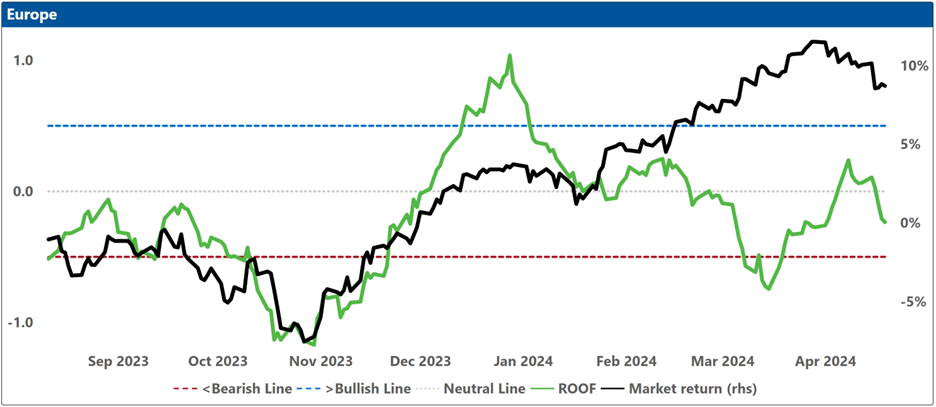
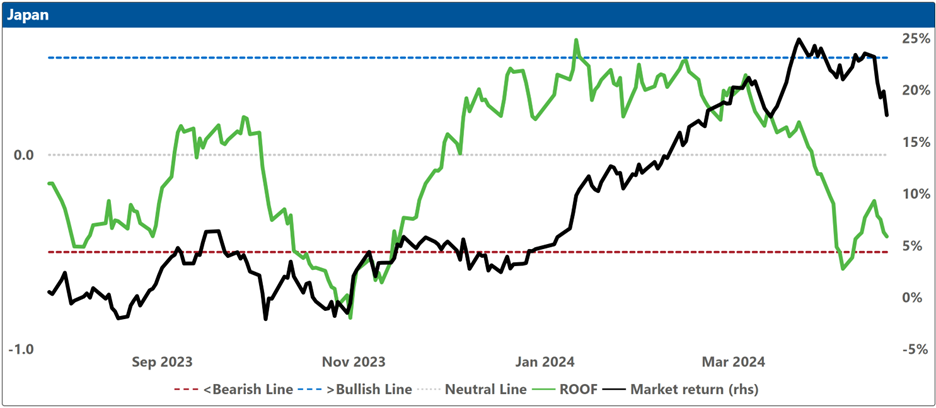
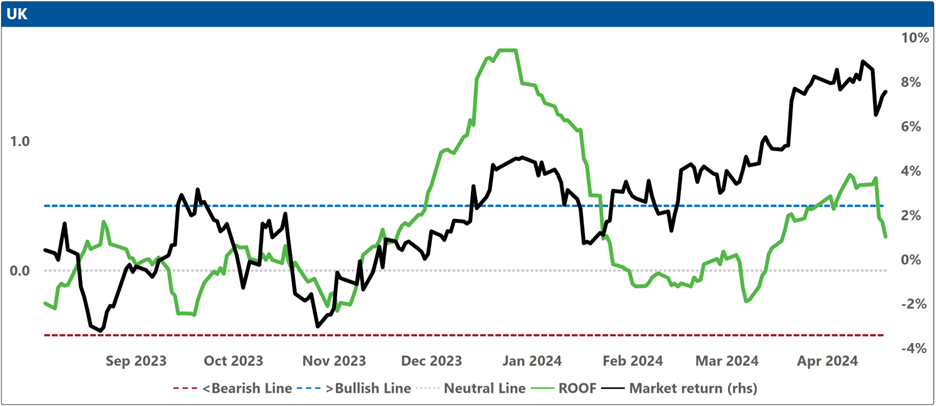
How to read these charts: The top charts show the ROOF ratio (investor sentiment) in green (left axis), against the cumulative returns of the underlying market in black (right axis). The horizontal red line at -0.5 (left axis) represents the frontier between a negative sentiment (-0.2 to -0.5) and a bearish one (<-0.5), and the horizontal blue line at +0.5 (left axis) represents the frontier between a positive sentiment (+0.2 to +0.5) and a bullish one (>+0.5). Around the horizontal grey line at 0.0 (left axis), sentiment can be considered neutral (-0.2 to +0.2).
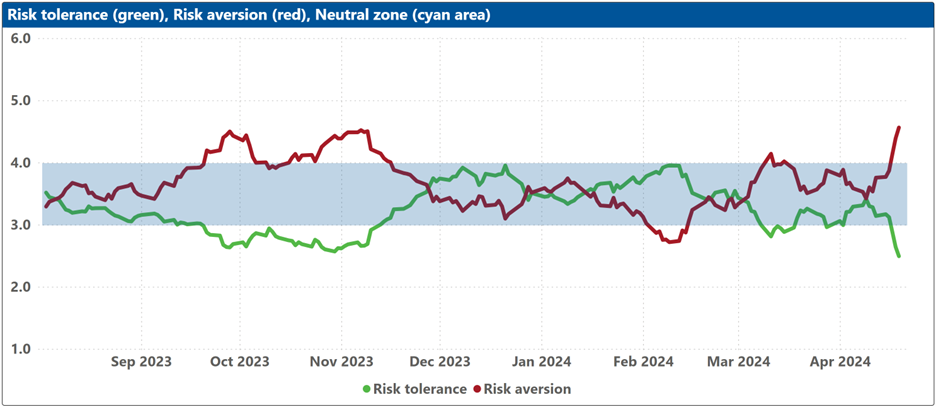
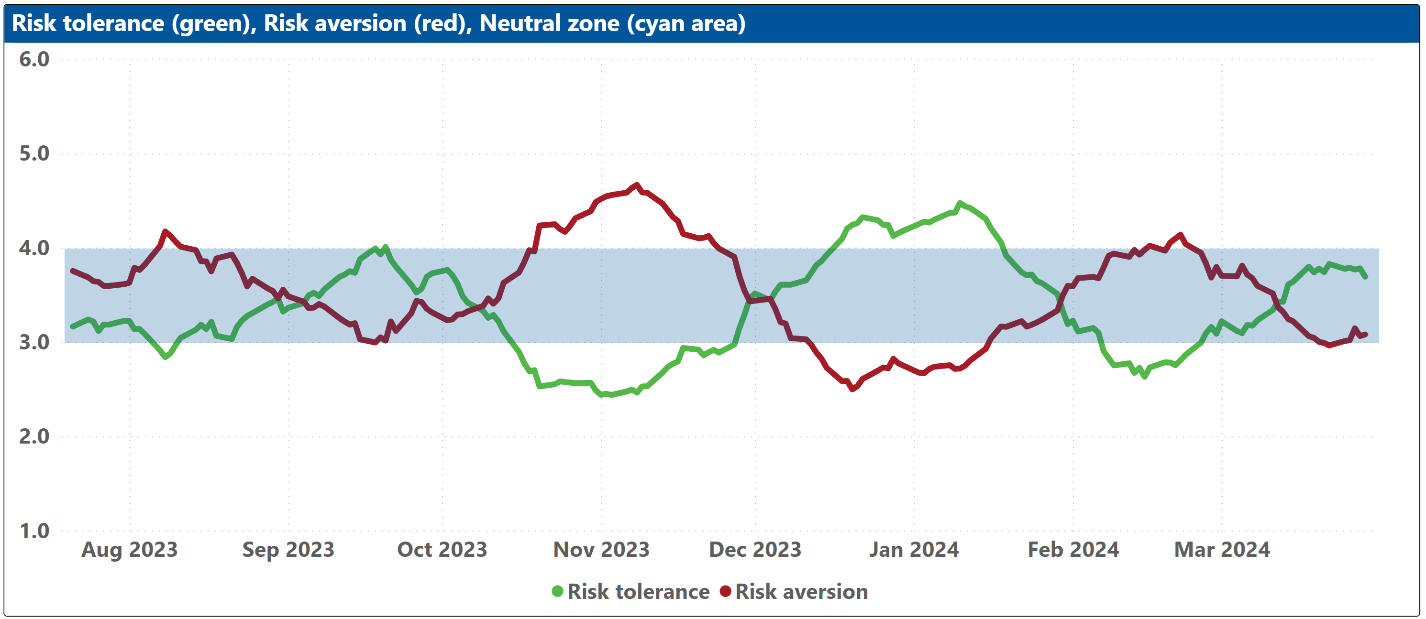
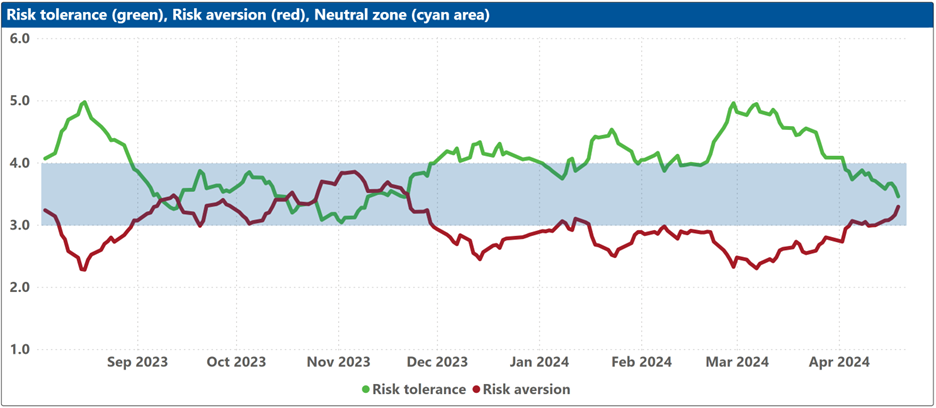
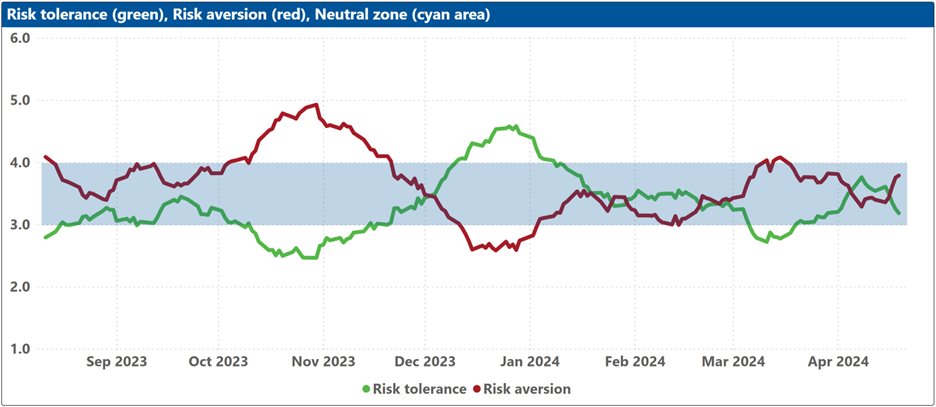
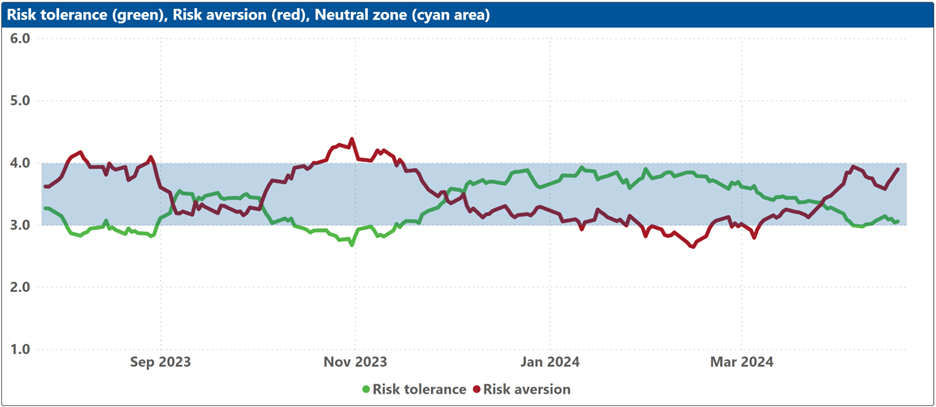
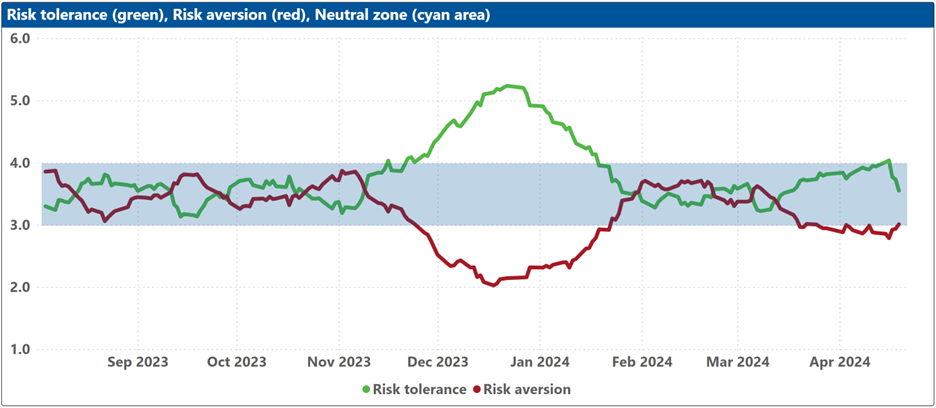
The bottom charts show the levels of both risk tolerance (green line) and risk aversion (red line) in the market. These represent investors’ demand and supply for risk. When risk tolerance (green line) is higher than risk aversion (red line), there are more investors looking to buy risk assets then investors willing to sell them (at the current price), forcing risk-tolerant investors to offer a premium to entice more risk-averse counterparts to take the other side of their trade, which drives markets up. The reverse is true when risk aversion (red line) is higher than risk tolerance (green line). The net balance between risk tolerance and risk aversion levels is used to compute the ROOF ratio in the top charts, representing the sentiment of the average investor in the market.
The blue shaded zone between levels 3-4 for both indicators represents a reasonable balance between the supply and demand for risk in the market. Conversely, when both lines are outside of this blue zone, the large imbalance in the demand and supply for risk can lead to an overreaction to unexpected news or risk events.
Asia ex-Japan
Australia
China
Developed markets
Developed markets ex-US
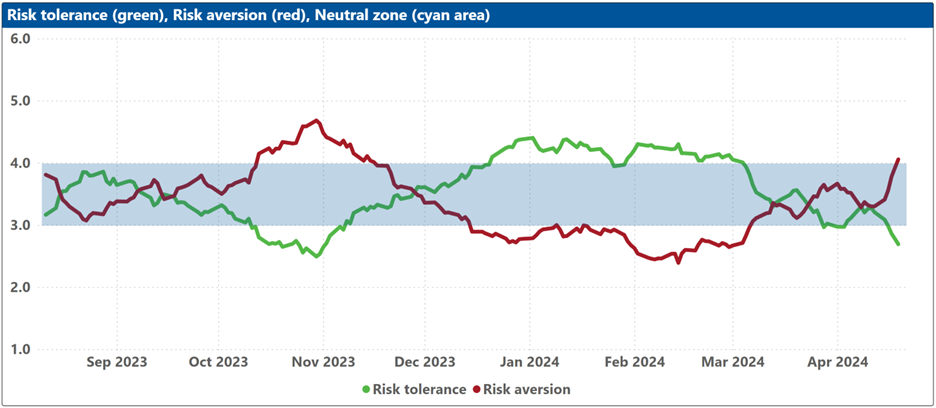
Emerging markets
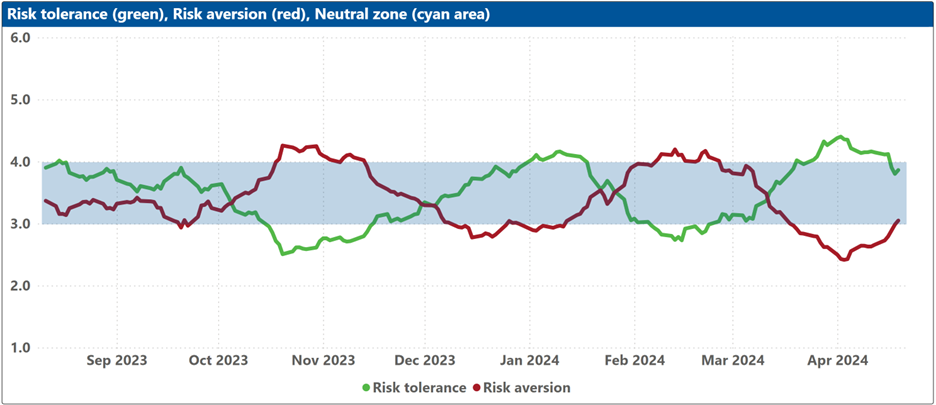
Europe
Japan
UK
US
